
The Auto Trade chartbooks are divided into two charts: S3 with Volume Bars on the left (Chart #1) and S2 with Flex Renko / Heiken Ashi bars on the right (Chart #2).
The Size of the Volume Bars and the Flex-Renko bar settings are changed in the Chart Settings.
The charts are not sensitive to time zones, they are based on 24 hour days with no evening sessions.
When the Auto Trade software calculates when a valid Long Entry, White Up arrows appear below bar, and when it finds a valid Short Entry, Yellow Down arrows appear above the bar.
The entries that are indicated in the past are not real, the only indicate a trade would have taken place at that time if all Auto Trading switches are turned on. The only Arrows that will result in a trade entry are the ones that appear on the last bar to close. A Market Order will be submitted on the close of of the Signal bar if the signal is present.
Click here to learn more about enabling Auto Trading in Sierra Chart: Auto Trade Setup in Sierra Chart
Here is a summary of the Auto Trade controls:
Live or Live Sim:
Needs Send Orders to Trade Service set to Yes
Trade Simulation Mode On Unchecked.
Local Sim (PC simulation)
Needs Send Orders to Trade Service Set to No
Trade Simulation Mode On Checked.
Trade Rules Settings
- For each chart, edit the Study Settings for: ID8: S3 Inputs (Horizontal Lines)
- MIN TICKS (Current bar must close at least this many ticks from previous bar). Impacts color bar study and auto trade.
- MAX TICKS (In order to be a possible valid entry bar, it must not have moved more than this number of ticks from the previous bar.
- Daily Max Loss Value: Stop Auto Trading if the PL for the day gets to or below this NEGATIVE number. This is Daily Loss Limit is Currency ($) without commissions.
- Daily Max Profit Value: Stop Auto Trading if the PL for the day gets to or above this POSITIVE number. The Daily Profit Limit is currency ($) without commissions.Note that the Auto Trade arrows will disappear after either MAX Value is reached. If you wish to continue to view the output (arrows) of the study, Simply disable Auto Trade for the Chart, then increase the number (or decrease the loss value if your net PL is negative) to view the arrows again.
- VWAP Rule: If this is set to 1, the VWAP rule is in effect. (No shorts if the last bar closes above the upper band of the VWAP study, no longs if below the lower band.) Default setting: 0.
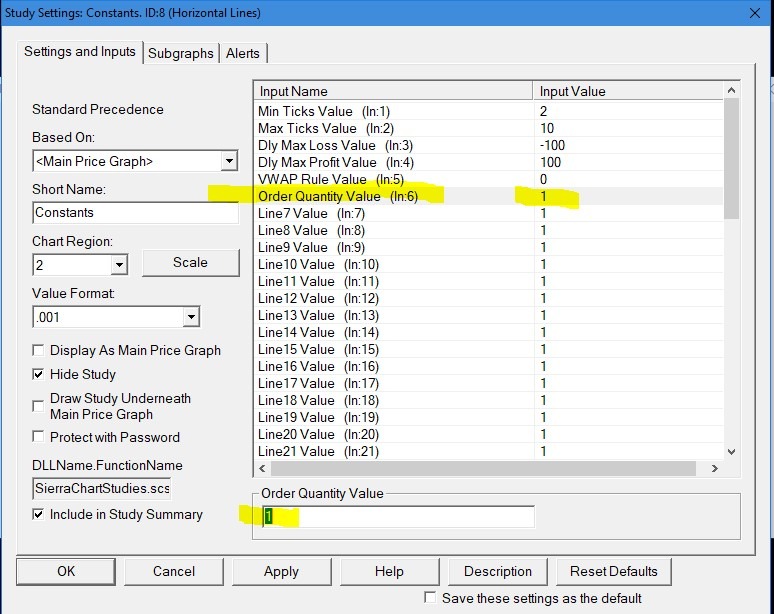
Changing The Order Quantity
- In order to change the number of contracts traded, the S3 Inputs Study “Order Quantity Value” needs to be modified. If your attached order is for one contract, and you change the study value to two, it will make two entries with 1 contract each. You can modify your attached order to use 2 contracts, for example, one with a close target, and one with a runner.
Creating Custom Chartbooks
- The Mega Bundle includes four templates for custom symbols. Open one of the S3 Custn yyymmzz.cht files and change the symbol on Chart #1, the S3 Vol Chart. Your new symbol will be applied to all relevant charts.
- Save the file with the same name.
- If you decide to save the file with a new name, then you should make sure you don’t use the same Custn chartbook for another symbol, as the SCSS will will be associated with two chartbooks, and that could cause problems.