Introduction
The Volatility Stop is an add-in for any Sierra Chart chartbook, that automates your trailing stop levels. It is based on the Average True Range, so it gives wider stops in high volatility markets, and tightens them in times of low volatility. This chart can be added to any chartbook (not just auto trading chartbooks) to automatically manage a trailing stop that moves in relation to volatility. It follows a multiple of the ATR and applies it to the current price. A tick offset can also be applied. Stops only move in one direction. The combination of an automatic trailing stop and an auto trading system for entries, can be a very powerful addition to your trading toolbox.
Installation
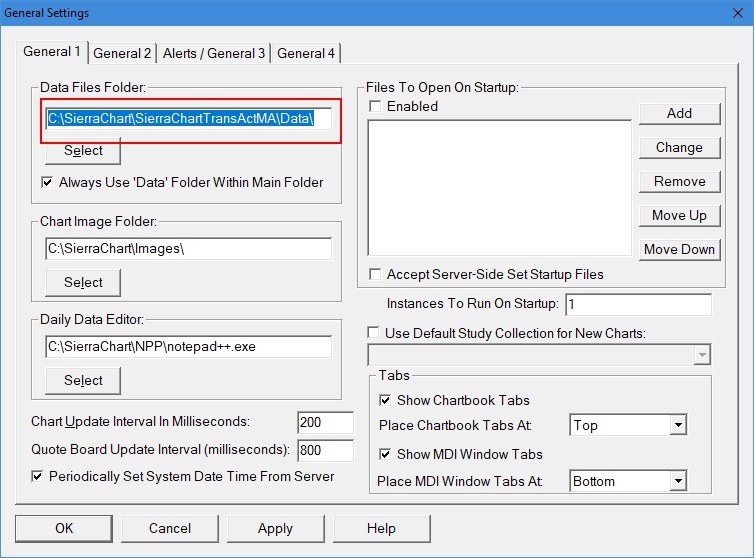
Download the Zip file and open it to extract the CHT file, then save it in your Sierra Data folder, which varies depending on your broker. Check Global Settings>>General Settings if you are not sure where that is. This is the setting for Infinity Futures:
Setup
- Open Chartbook ATR Stop yymmdd.cht
- Right Click on the ATR Stop tab at the bottom and select Duplicate Chart to Chartbook and select the chartbook you want the ATR Stop inserted.
- Check the box “Switch to this chartbook”, and then click OK.
- The ATR Stop chart has its symbol linked to all charts with Link Number 1. This way you don’t need to change anything unless the chart you want to have managed stops is linked differently. Most Forgiving Computers chartbooks use Link 1 for the auto trading charts. However, if you want to add ATR Stop to another chart, you need to change the link number. Check the link number of the chart you wish to manage by opening chart settings, and going to Advanced Settings 2 and note the link number.
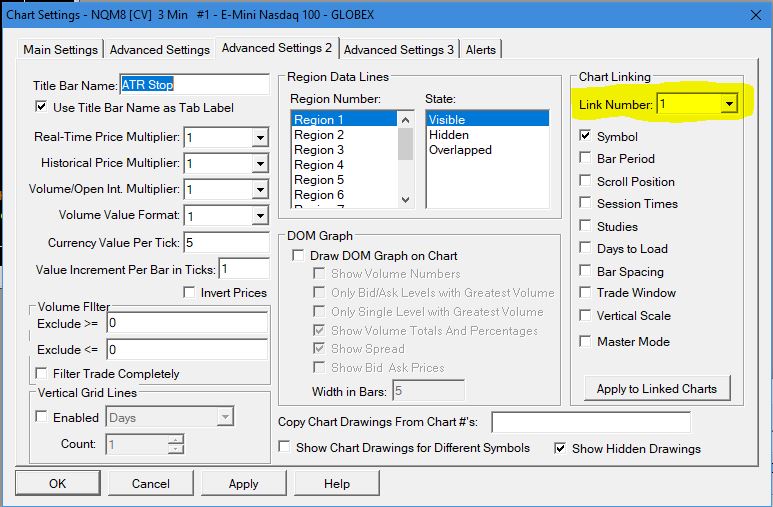
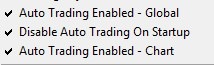
Then open the same chart settings for the ATR Stop chart and modify the link to match the chart you want to add the trailing stop to. - With the ATR Stop chart selected, enable Auto Trade Global and Auto Trade Chart (on by default). ATC may be used to toggle the use of the automatic trailing stop.
- Trade management uses attached orders, so make sure “Use Attached Orders” is Checked on the Trade Management window, and you have configured the initial target(s) and stop(s).
- Test the Automatic stops in simulation. Try an attached order with a very high stop and target. Enter a long or short market order, and watch to see if the stop moves. If there is no motion, make sure Auto Trading is enabled for both Global and Chart (for the ATR Stop Chart).
- Optional: Adjust ATR Multiplier and Offset (See below)
- Optional: Adjust Time frame and ATR periods
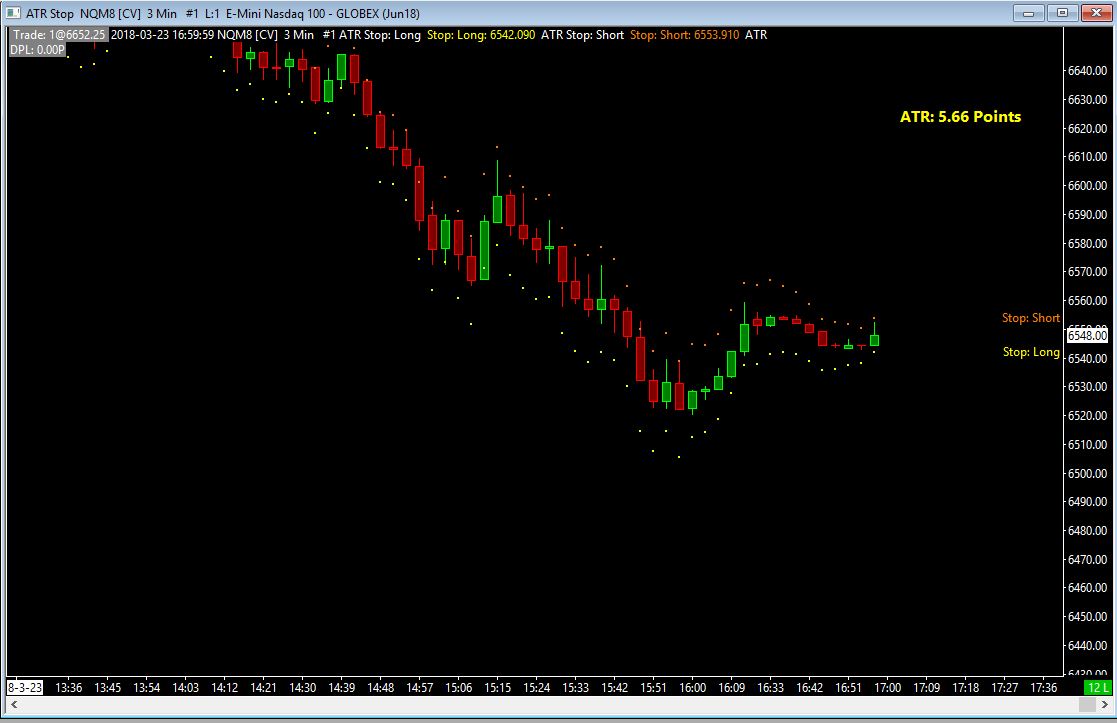
- The ATR Stop chart is time based, and converting it to a range, tick, or volume based chart will alter the ATR to not be an indicator of volatility, causing inaccurate trade exits. A higher time frame will cause the ATR to increase, widening the stops and the stop will move more slowly. The default is 1 min. You can change this in the ATR Stop chart settings.
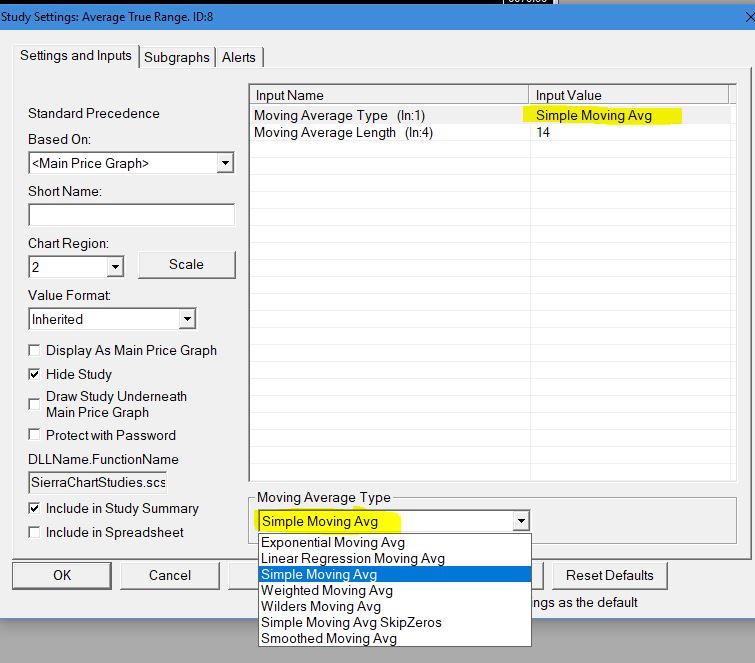
- ATR Periods. Increasing it will smooth out the ATR and reduce it. You can change the period in Study ID8 Average True Range. The default is 14.
- ATR Moving Average Type: You can change the type of moving average used in the ATR calculation as well.
ATR Multiplier and Offset:
The Stops are calculated by taking the Average True Range of the last 14 bars, multiplying it by a number called the ATR Multiplier and adjusting it by an offset in ticks. The ATR Multiplier allows you to adjust the relative impact of ATR on the stops. The default ATR Multiplier is 1.
The Offset is added or subtracted from the adjusted ATR, to provide an additional fixed distance away from the ATR stop. A positive offset will widen the stops, a negative offset will tighten them. The default Offset is 1 tick.
For example if the ATR is 5, the multiplier is 1.2, the offset is 2 and the tick size is .25, then the stop will be:
Stop in Points = (5 x 1.2) + (2 x .25) = 6.5
The ATR Multiplier and Offset are adjusted in the Input Study (ID1) of the ATR Stop Chart.
Usage
The auto stop is ready when it is added to a chartbook. It can be added to any chartbook, whether or not it is an auto trading chartbook. Automatic stops are a form of auto trading, so Auto Trading – Global must be enabled, as well as Auto Trading – Chart for the ATR Stop chart. It will monitor price action and along with the ATR of the 1m chart it is based on, compute stops for both longs and shorts. If the initial stop is tighter than the ATR stop, then nothing happens. When the ATR stop is closer than the initial stop, then it will start moving the stop based on the current value of the ATR. It will check every 10 seconds, but it will only move the stop in a direction that improves your risk.
Note: If you have multiple stops, then only the closest one is moved. This may be important in your trade management decision.
Adjusting the ATR Multiplier will change the probability of being stopped out. Since it is based on the ATR, it is possible a candle will move more than the ATR. By increasing the ATR multiplier, the result will be wider stops, with fewer hit, but potentially higher losses. There is no one size fits all, so it is valuable to determine what multiplier works best for you.
If you wish to add the ATR stop to a chart book with multiple charts using different symbols, then you need to Duplicate the ATR Stop chart and then change the duplicate’s link number to match the chart you want to control. This is not necessary if you have multiple charts trading the same symbol, like the S3 T3 Combo.
You can minimize the ATR Stop chart window or leave it open to see where the stop locations would be.
You can add buttons to the Control Bar to enable and disable Auto Trading. Read about that here.