Move your stops and targets together. This tools adds a missing feature to Sierra Chart: The ability to modify a bracket in one step. The OCO Bracket Move Tools monitors your nearest stop and nearest target. If it detects a change, and the study is enabled, the other side of the brack order moves. Move the stop, the target moves. Move the target, the stop moves. On Sale now at $49.99. https://forgivingcomputers.com/product/fc-oco-bracket-move-tool-for-sierra-chart/
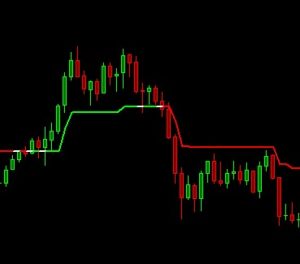
StepMA Indicator is now available for Sierra Chart
A popular indicator for determining trend, the StepMA is now available to Sierra Chart users. This tool is responsive to trend changes, and indicates range bound conditions with a flat line, which can keep you out of chop.
Click here for more information.
Announcing: Advanced Risk Management Tool
Have you ever wanted someone watching out for you, helping enforce your trading plan rules, and telling you when it is time to stop? Now you can add a custom study to any chart and have it keep track of:
- Consecutive Winning Trades
- Consecutive Losing Trades
- All Trades
- Cumulative Loss
- Drawdown
This study can count these not for the day, but for the last so many minutes. When the triggers are met, all trading is locked, forcing you to wait, or make some adjustments.
The study can only see trades and profit/loss data on the chart it is attached to. However, when it locks trading, it locks for all chartbooks and charts. An Emergency Flatten button can get you out a position if the trading is locked.
Let’s say you want to lock trading (i.e. no new trades, no modifications, no exits) for 5 minutes if you have 3 consecutive losses in the last 10 minutes.
The on-screen summary panel looks like this:

If it gets to 3 losses, it will look like this:

Feature 1 handles the counts of Wins, Losses, and All trades.
Feature 2 handles the Cumulative loss
Feature 3 handles the Drawdown
Feature 4 handles Eight No-Trade Time Periods

The price of this study is normally $29.99 but it is available for a limited time at $24.99. Click here for more information.
S3 T3 Combo Chartbook Combines S3 and T3 in one Display
Save 15% off the monthly subscription when purchased as the combined trading systems and chartbook and also get the original S3 and T3 packages included.
The popular S3 and T3 systems have joined forces with the S3 T3 V3.3 Auto-Trading System.
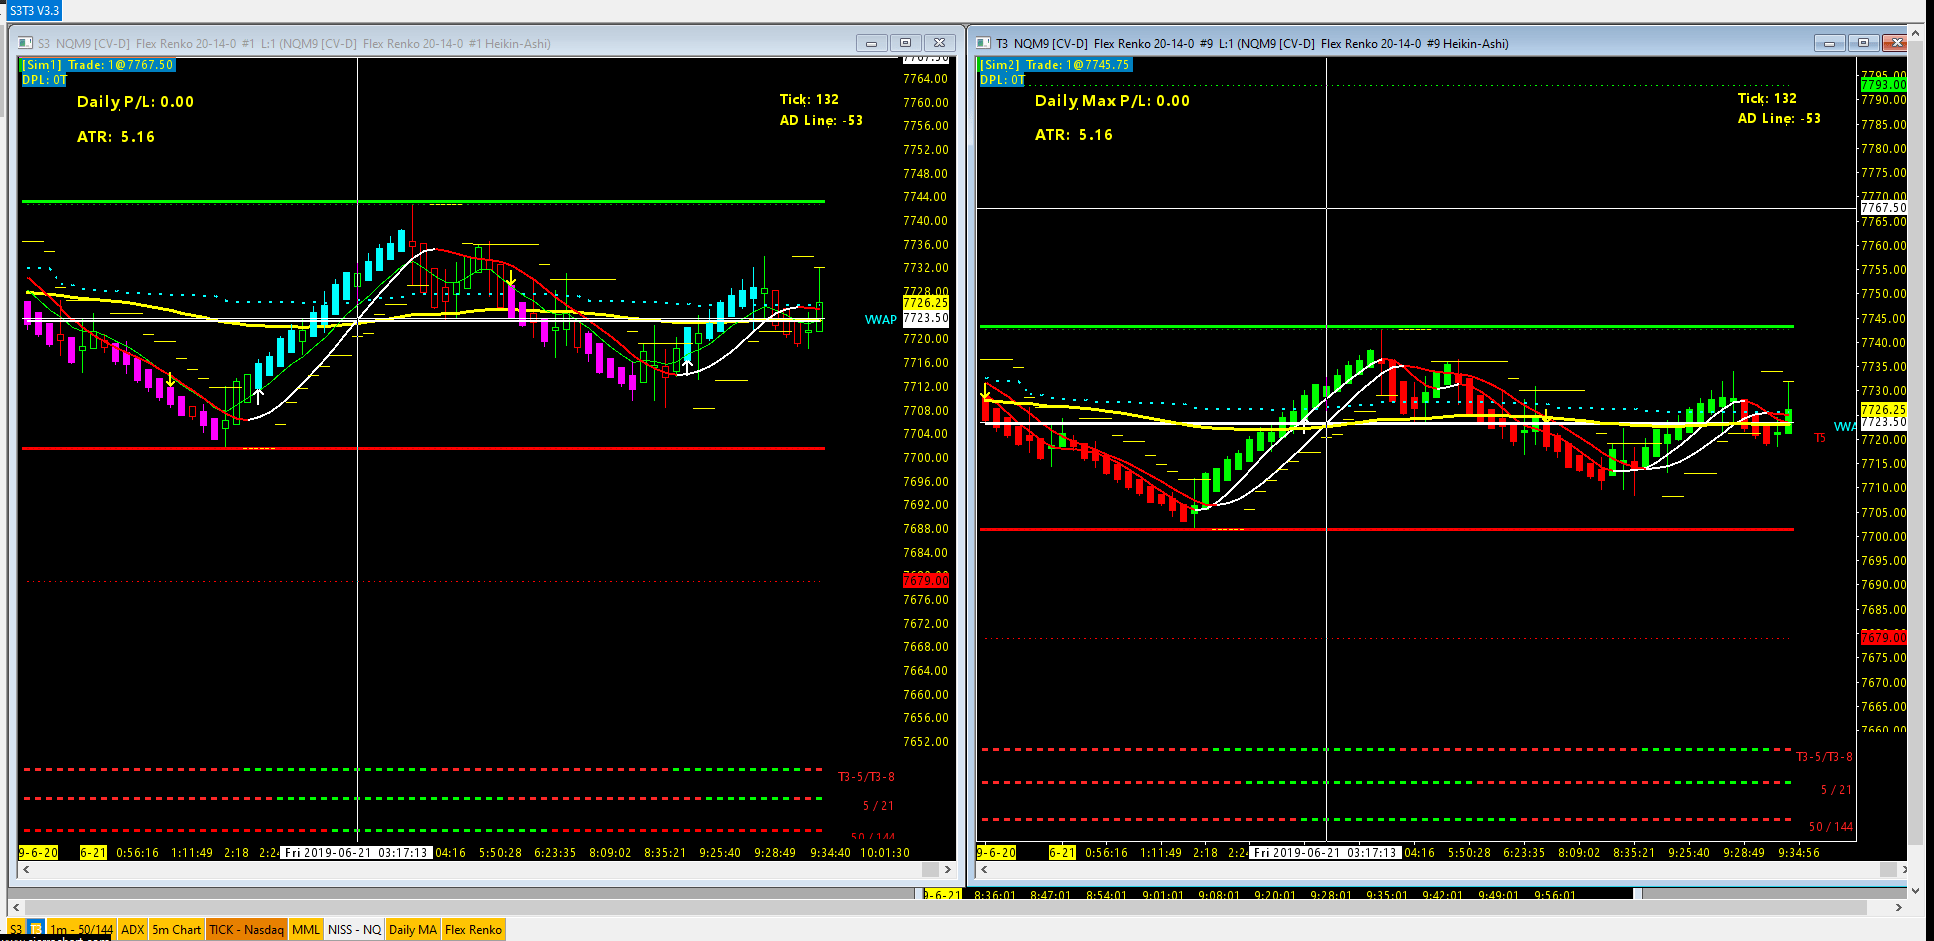
The left chart shows the S3 System, the right chart shows the T3 System. S3 is for short term “scalpiing” trades, and T3 is “Trade the Trend” which looks for longer term confirmation of trend baed on 3 different time frames. Either one or both can be enabled for autotrading. The charts include the latest versions of the S3 and T3 studies. When the S3 T3 combo is purchased, the S3 and T3 systems are also included as separate chart books.
Current subscribers to the S3 T3 combo are entitled to this latest update at no extra charge. Restart Sierra chart to get the new files.
More info here.
Why Risk Management is Important, Especially with FOREX
In trading, capital preservation is key. There will always be losses, so protecting your account against several losses in a row is what good traders do. They do that by limiting their risk on every trade. If you risk 50% of your account balance on a single trade, you can see how losing two or more trades in a row will lead to large drawdowns. Trading with a relatively small amount of risk will help keep you around to trade another day.
A good trading plan will allow for a maximum loss per trade, or per day, or week. Let’s look at the maximum loss per trade. A good Risk Tolerance would be 1% to 3% of your account balance. This means if your account balance is $10,000 you would be willing to risk $100 to $300 on any trade. Let’s use 1% for this example.
Now the problem is, where do place your stop, and how to ensure you only buy or sell the right number of units (contracts) to keep your maximum loss? With Futures trading, you pretty much know how many contracts you can buy or sell, because your account balance and margin are such that it could be a low number, say, 1, 2, 5, or 10. You also know with futures, how much a stop is in ticks, so you can mentally do the math and determine the max loss per trade. So for NQ, if the tick size is .25 and it is worth $5 a tick, and you want a 10 tick stop, then you can do the math in your head: 10×5=$50.00. With a $100 max loss (1% of the account balance), then you can put on 2 contracts with a risk of $50 each to reach your $100 Max risk.
With Forex, it is a whole different ball game. First of all, the tick size is usually 0.00001, and the number of positions can easily be in the 10’s of thousands. Also with Forex, you have your account currency, the base currency, and the quote currency, some or all of which factor into the math. Note that the calculations are different if the three currencies are all different, or if two are the same (e.g. account currency and quote currency). The Tick Size for JPY is also different.
Ok, so assuming we know how to do the math, are we done yet? Well, no. Your margin and leverage play into determing the final number, as does the limit your broker may place on any currency pair trade. Finally, if you have any open positions, you may have insufficient funds available to put on the next one, so that needs to be comprehended before you try to spend more than you have available to spend.
Don’t know how to do the math? There are websites that can help you calculate the proper position, and you can also do it in a spreadsheet if you can create or acquire one that does this. You would have to key in by multiple inputs based on your stop criteria, and hope the market doesn’t move significantly before you have had a chance to enter the orders.
What would really help is a tool that streamlines the process and automates as much of the data gathering as possible. A tool that lets you focus on your trading strategy, and give you confidence that you will be only risking the proper amount according to your trading plan. The actual quantity is just a number, as long as it keeps you with your max loss per trade limit, you don’t really care what it is.
To address this problem, Forgiving Computers announces the availability of the Forex Automatic Advanced Order Size Risk Management Tool And Trailing Stop Manager. This revolutionary tool lets you enter your stops on the chart with the mouse, and with a few clicks, complete the complex order size calculations and submit your order. Developed in cooperation with a professional Forex trader, this tools simplifies the entire process and saves your brain for trading and not multiplying and dividing very large and very small numbers.
It also enters up to 5 targets, each based on a multiplier of your risk. Once in the trade, a sophisticated trailing stop will work on your behalf to help keep you in the green, and it will allow you to have your final target become a runner that trails based on teh Kiwi Trailing Stop.
New Version of the S3 System
The S3 and T3 auto-trading systems have been updated to enhance functionality and make them easier to use. When switching from Sim to Live to trade, you no longer need to change the study setting: Send Orders to Trade Service. The setting is automatically changed when you switch the Trade Simulation Mode Enabled menu item.
The S3 system also will try to minimize losses if you use the Max Daily Loss setting. Instead of waiting to close the trade to check of the daily loss limit has been reached, the values are continuously checked, and any open position will be flattened if the Maximum Loss is reached. Note that the Max Profit will still stay in the trade, in case it goes even higher, you won’t miss out.
Current customers of the S3 system can restart Sierra Chart to pick up the changes automatically, and the updated documentation is available in My Downloads.
Using a Runner with Two Contracts
Trading one contract limits your options. You have a stop and a target. You can move the stop manually or automatically. Let’s say you have a target of 40 ticks and a stop of 20, with a reward to risk ratio of 2:1. If you want to move the stop to BE and still maintain a 20 tick margin, you would move the stop to BE when you reach 20 ticks of profit. What if I told you that you could move the stop at 10 ticks of profit and guarantee yourself a zero loss trade?
Using two contracts where one comes off early and one is a runner, gives you a better chance of a winning trade, while increasing the likelihood of a zero loss trade. Wouldn’t you rather break even than have a loss? (Note that if the trade moves against you from the start, there is a chance of losing 40 ticks, so this is not a guranteed setup.)
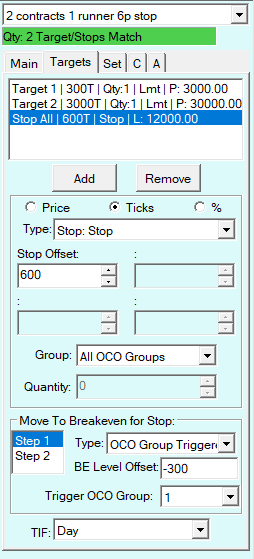
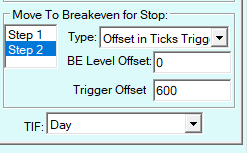
The idea is to take one contract off quickly, and move your stop, so the second contract still has room to move, without a net loss. If the first Target is 10, when it comes off, move the stop to BE-10 (or-9 if you want to account for commissions). Then the second contract still has 20 (or 19) ticks of wiggle room before it gets stopped out, and it if does, it it a zero loss trade. If it “Runs” then every tick it moves above 10 is net profit. You can move the stop to BE when the second contract gets to 20, and you are guaranteed a 10(or 9) tick profit. You can manually move the stop from there or just leave it at BE.
The runner now has a chance to really run, because you set the target high enough to give you a good win. If it looks like price is going to keep on moving, you can move the target higher, to take advantage of the trend.
Example: 1 point = 100 ticks. Preferred stop is 6p = 600 ticks
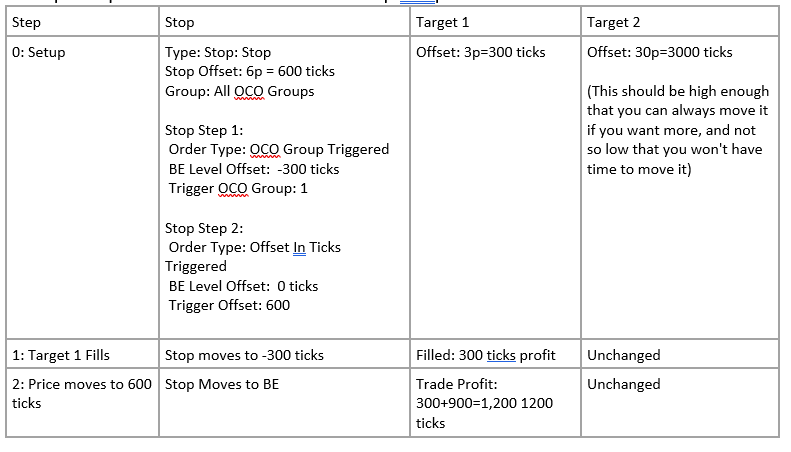
Possible Results:

Trade Window Setup:
DLLs, Spreadsheets, and How Study Timing and Precedence Matter
Ever noticed that the Sierra Chart study settings window has some information in it that looks like this:

S3 V3 Study Settings Shifted over
Each study has a time in ms (milli-seconds) and a
Each study is a function or subroutine that is called multiple times a second, and the time it takes to do that is important if you want your study to make a trading decision in the shortest amount of time. The order in which the study is called is also important, as many studies rely on the results of other studies, and in order to get the latest results, you don’t want a study that needs data from another study to run at the top of the list, as it may end up getting old or incorrect data.
The placement of the custom study functions in the list is predetermined to optimize the timing and precedence of the information needed. Non-essential studies are moved below the custom studies, as no automated decisions are being based on them.
Note that Sierra generally calculates the precedence based on the studies themselves. Each built-in study as a Standard, Low, or Very Low Precedence. In general you can change the precedence of a study by moving it up or down the list.
One of the studies with very low precedence is the Spreadsheet System for Trading Study. It sees the output of all the studies that do calculations, so it automatically comes later than a DLL based custom study/system that does not need all data, just the data it cannot get internally which it gets from other studies on the chart. The DLL ends up running with a lower ms timing, and earlier in the list than a spreadsheet. However, Sierra Chart does not automatically determine what data the custom function relies on upon determining the proper CalcOrder for a study. It is therefore important not to move studies up or down without recognizing the impact that change may have on the accuracy and performance of the custom studies.
Custom Studies, Alerts, and Trading Systems
Forgiving Computers develops custom tools that can help you with your trading. We use the extensible features of Sierra Chart, including spreadsheets, ACSIL (C++ DLLs), custom alert formulas, and trade management based on your rules.
Some examples:
- Studies: Completely new or a combination of existing studies
- Alerts: Signal conditions that depend on your rules
- Trading Systems: Automatic Entries, Exits, moving stops and targets, scaling in and out
If you can describe your needs in objective terms, it can probably be coded.
Contact us for a quote:
Why are DLLs better than Spreadsheets?
Forgiving Computers began developing trading systems using spreadsheets for Sierra Chart. If you are familiar with Excel or other spreadsheet applications, you know spreadsheets provide a quick way to do number crunching with immediate results. The Sierra Spreadsheet functionality integrates the ease of use of spreadsheets with the ability to combine price action data, with study results (Moving Averages, Bollinger Bands, etc.) and create signals or new studies based on the data of the current and previous candles.
A Dynamic-Link Library, or DLL, is an Application Extension that adds functionality to Windows applications in a modular way. Studies provided by Sierra Chart are written in C++ and compiled into DLLs. Customs studies and systems can be added to your charts the same way. DLLs can be shared across charts and chartbooks with none of the drawbacks of sharing spreadsheets across chartbooks.
There are several advantages to this approach.
- Speed
- Memory
- Independence
- Complexity
Speed
Because DLLs are compiled, they use the processor’s native instruction set to perform calculations. Spreadsheets add layers of overhead. Whether it is a Spreadsheet Study, System with Alerts, or Trading System, the data has to get into the spreadsheet in the proper format, be processed with the specific formulas needed to determine the results, and then translated back into the study that incorporates the results into your charts. Also, the spreadsheet has to wait for all the studies to complete their processing before beginning to evaluate results. All that takes time, even though the spreadsheet study itself is compiled, the formulas that make up the spreadsheets are converted from Excel format to an internal format. This can result in trades being taken fractions of a second later than with DLLs.
If you use the same spreadsheet in multiple chartbooks, using the same chart number, Sierra will update the “sheet” for the first chartbook, then moments later, update the next, and so on. This is inefficient and can cause more delays. (This is why you need to take extra steps to “clone” a chartbook with spreadsheets.)
Memory
DLLs take up less space in memory and on your disk. One copy of the DLL is sufficient for all the charts it is attached to, where you need multiple copies of spreadsheets to avoid the above update cycle. Less memory usage also improves performance.
Independence
A compiled C++ DLL study is “linked” into the main Sierra application, in as many places as you like. No “cloning” is needed to maintain top performance, as is necessary with spreadsheets.
Complexity
More functionality is available to the custom study with DLLs. For example, BID/ASK data, and Volume Profile data can be incorporated into a custom study with DLLs, but not with spreadsheets.
Other advantages include automatic installation and updating, user-based licensing, copy protection, and time-limited trial versions.
There are some disadvantages to using DLLs. Spreadsheets can be used to quickly develop studies to try out ideas and see results quickly. C++ requires some programming skills, where spreadsheets require some Excel skills. As with anything worth learning, expertise comes with time.
Conclusion
C++ based custom studies provide the best methods for adding functionality to Sierra Chart. They can be used for new studies, creating alerts, and for complete auto-trading solutions. Forgiving Computers is in the business of providing trading solutions. We will develop most new studies in C++, however, we will also do custom spreadsheet solutions for customers that want them. Either way, we want you the trader to be successful with the custom decision support tools we provide.
