
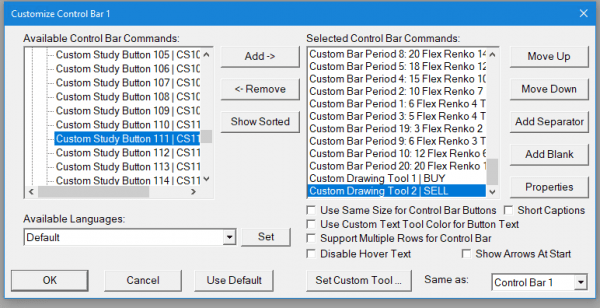
- Find the Custom Study for the Number you need to use, on the left. On the right side, select where to insert the button on the list. The lower you put it on the list, the farther to the right the button will appear. I will put it on the bottom so it will be on the far right.
- Note that the button captions and description text will be provided by the study when that chart is selected, so you don’t need to do anything with the properties, unless you want to change any of the other properties, such as the size of the font.
- Click Add-> and click OK. You should see this on the far right of the Control Bar.

- Note that the button captions and description text will be provided by the study when that chart is selected, so you don’t need to do anything with the properties, unless you want to change any of the other properties.
Some studies can be controlled with Advanced Custom Study Button. Each one is assigned a number from 1-150. The Study can interact with the button by changing the text label and checking the state of the button. If the button is in, it is On, if it is out, the button is off. You can change what button number a study will use in the study settings.
First, you need to know which ACS number you want to use. This will be in the study settings.
In this example, we want to add ACS Button 111 to Control Bar 1
- To do this click Global Settings>>Customize Control Bars>> Control Bar 1 (or whichever one you are using).
- On the left scroll down to Advanced Custom Study Buttons and click the “+” sign to expand the list:
- Find the Custom Study for the Number you need to use, on the left. On the right side, select where to insert the button on the list. The lower you put it on the list, the farther to the right the button will appear. I will put it on the bottom so it will be on the far right.
- Note that the button captions and description text will be provided by the study when that chart is selected, so you don’t need to do anything with the properties, unless you want to change any of the other properties, such as the size of the font.
- Click Add-> and click OK. You should see this on the far right of the Control Bar.
- Note that the button captions and description text will be provided by the study when that chart is selected, so you don’t need to do anything with the properties, unless you want to change any of the other properties.