
The Chartbook should look something like this:
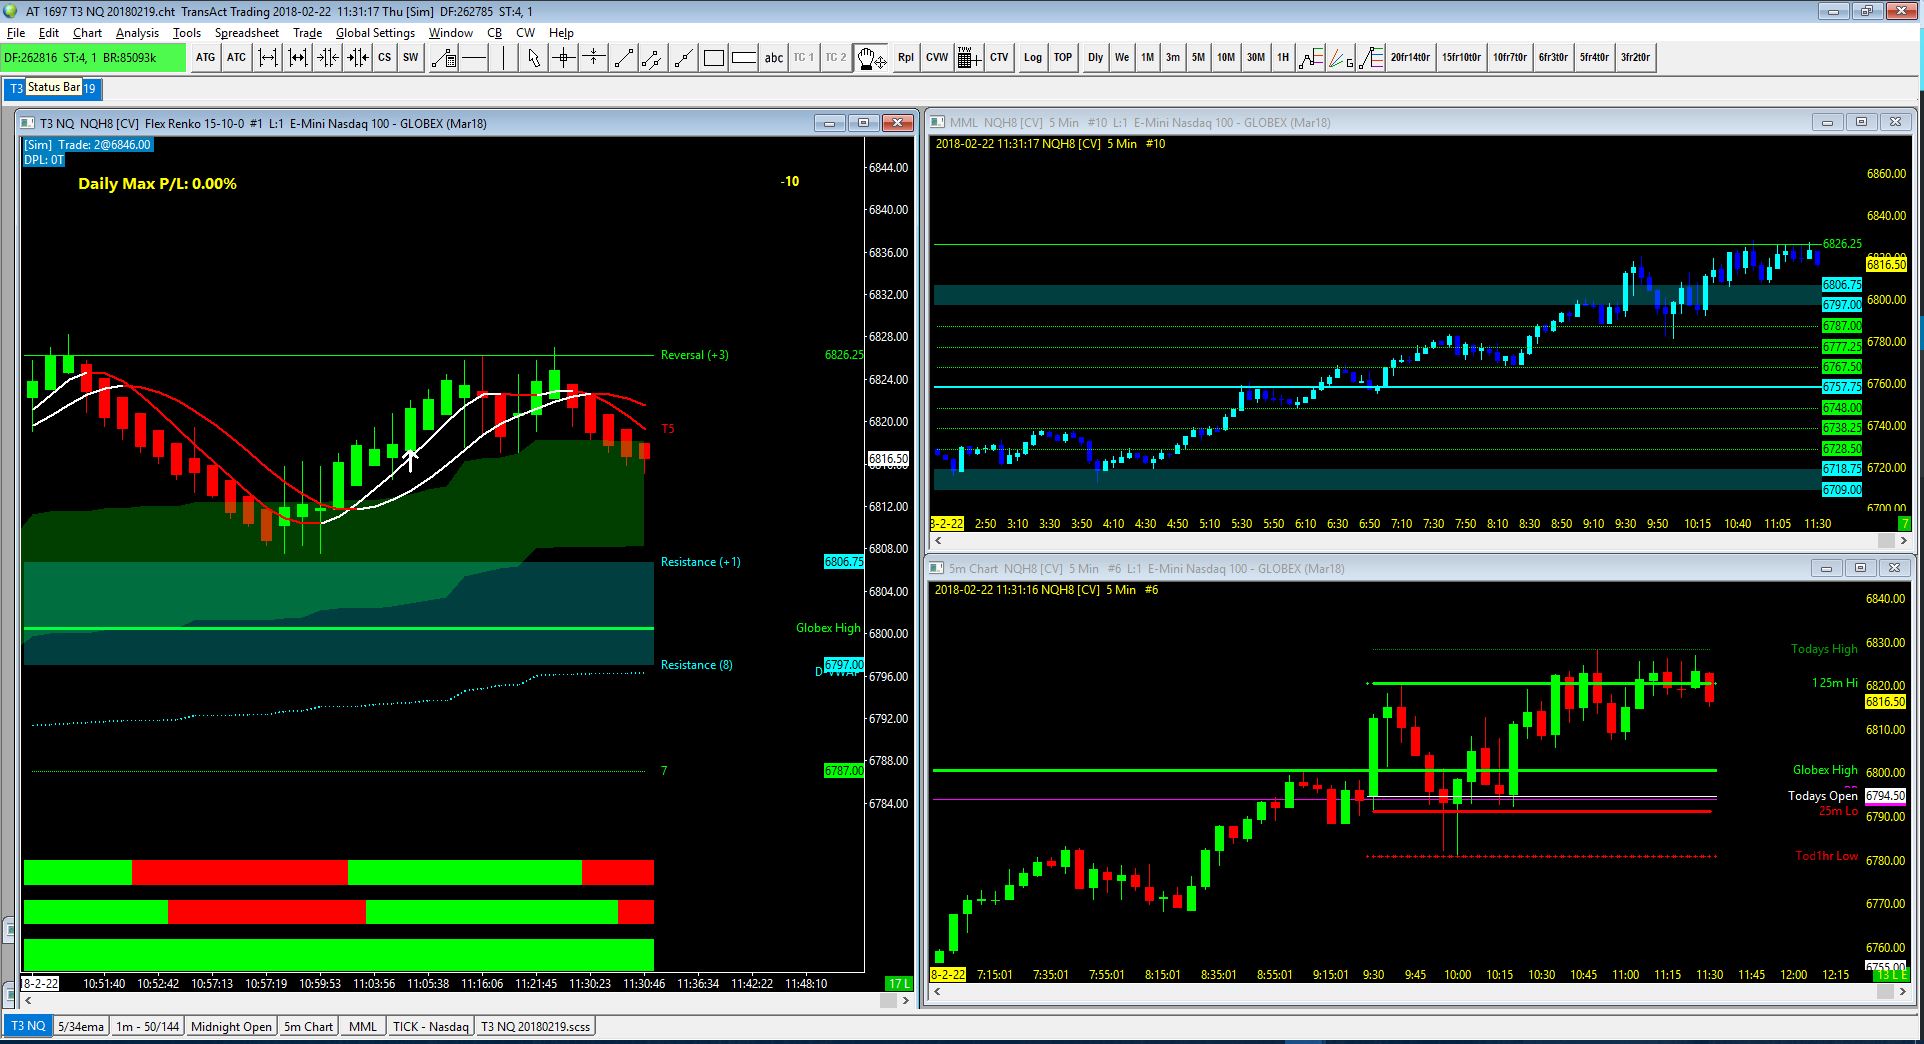
The charts are a follows starting from the left and going clockwise:
- T3 NQ: The main chart for trading.
- The candles are Flex Renko with the Heiken Ashi study applied to them.
- The Green cloud is the overlay from the hidden 1 min chart of the 50 and 144 exponential moving averages. When it is Green the 50 ema is above the 144 ema.
- The Blue band indicates two of the MML Resistance levels overlaid from the MML chart.
- In the upper right is the NASDAQ Tick value overlaid from the TICK-NASDAQ chart, which is hidden.
- The upper displays the progress towards the daily PL goals. Positive means a net Profit, Negative means a net Loss. (Note: Commissions are not included.)
- The three colored bars at the bottom are from top to bottom:
- T3-5 / T3-8: Green means T3-5 is above T3-8. One requirement for a long entry.
- 5/34 EMA: Overlaid from the hidden 5/34 EMA chart. Green means the 5 is above the 34.
- 50/144: Overlaid from the 1 min chart. Green means the 50 EMA is above the 144. Corresponds to the color of the 50/144 cloud.
- MML: This is a the 5 minute Murrey Math Levels chart. It is not part of the auto trader rule set. You may want to watch it for possible reversals and disable auto-trading at key levels. The chart is overlaid onto the T3 chart. You may want to change the period of the MML chart or the “Square Width” of the MML Mod study.
- 5 Min chart: This is provided with several key levels. If you are not trading in the New York (EST), you may want to adjust the hours so you get consistent results. (See Changing Session Times)
Hidden Charts: You can view these, but they should remain minimized as they are providing information to other visible charts.
- 5/34 EMA: Same time frame as the T3 chart. Changing the time frame or symbol on the T3 chart changes this one too. Provides the region 3 background colors.
- 1m – 50/144: A time based chart, with two MAs that get overlaid as the cloud on the T3 chart.
- Midnight Open: The start of a new trading day.
- Tick-xxxx: This is provided on chartbooks for the Stock Index futures (ES, NQ, YM and RTY). It provides the tick text data in the upper right of the T3 chart.
- T3 xx yyymmdd.scss: This is the Spreadsheet Study for Trading that controls the auto trading logic. You normally do not need to touch this. Nor do you need to save it when asked. You do need to take extra steps if you want to clone a chart book. See instructions here.
Creating Custom Chartbooks
- The Mega Bundle includes four templates for custom symbols. Open one of the T3 Custn yyymmzz.cht files and change the symbol on Chart #1, the T3 Chart. Your new symbol will be applied to all relevant charts.
- Save the file with the same name.
- If you decide to save the file with a new name, then you should make sure you don’t use the same Custn chartbook for another symbol, as the SCSS will will be associated with two chartbooks, and that could cause problems.