Configure Local Sim Trading

 SIM (Live or Simulation Server)

All trades are simulated on your machine, whether you are connected to the trade service or not. This is useful for backtesting your strategy and replaying trading sessions.

Check Trade>>Trade Simulation Mode On: 

  • Confirm trades are not being sent to the Trade Service.
  • Edit Studies: ID:5 S3 nn: 
  • Ln21: Send orders to Trade Service = No 
  • Confirm you have checked Trade> Auto Trading Enabled – Global and Trade>Auto Trading Enabled – Chart 

Auto Trade Setup in Sierra Chart

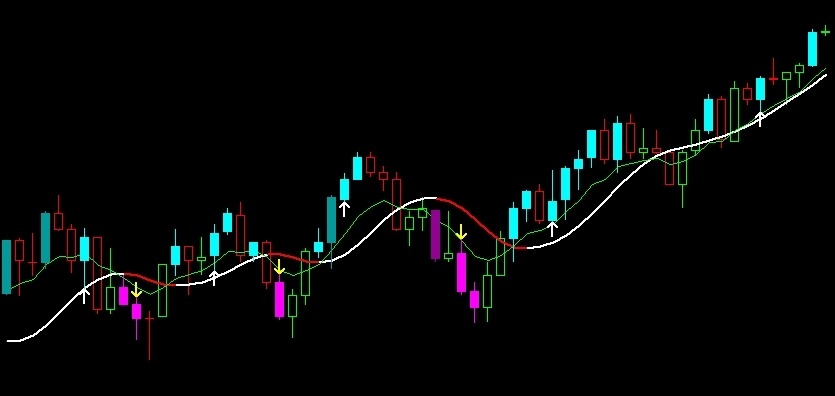
CAUTION: Auto Trading with live money is risky, and should NOT be enabled without supervision! There is no Holy Grail. It is not “Set it and forget it”. You are solely responsible for all trades taken manually or automatically. Plan on monitoring all Auto Trades.

Auto Trading in Sierra can be done in Simulation Mode (local or server based) or with Live Money. There are several safety checks in place to make sure you really want to trade live money. You can see the Auto Trade signals (Arrows) at all times, only if all the Auto Trade switches have been enabled will it trade live money.

Startup: Auto Trade is Disabled

Your Trade Menu should look like this when you start up Sierra Chart: 

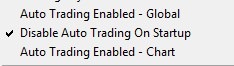
The only item checked is “Disable Auto Trading on Startup. This should stay checked. That way the next time you start Sierra, you cannot start Auto Trading unexpectedly.

Enable Global Auto Trading

This is the Master Switch that turns on and off all Auto Trading in all open chartbooks. Note that turning it on the first time will not begin Auto-Trading, it is more like the Big Red Switch or EMO that shuts off any Auto Trading that is going on. For now we will turn it on by doing Trade>>Auto Trading Enabled – Global.


Your Trade menu should look like this: 

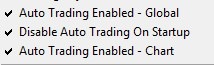
Notice that “Auto Trading Enabled – Chart” was also enabled by default, unless you are looking at a chart where is has been previously disabled. Any chart that you are OK with Auto Trading from should have both Global and Chart enabled.

Disable Auto Trading from charts you don’t want to auto trade from

Any chart you don’t want to Auto Trade from should have “Auto Trading Enabled – Chart”  UNCHECKED.

Like this:

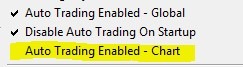
This setting is saved with the chartbook, so you won’t need to do this every time. The M8 Multiple Chart (8-in-One) Screen Share has this disabled for each chart.  See the link below for creating Tool Buttons to Contol Auto Trading.

Ready to Auto Trade?

Remember Auto Trading is not “set it and forget it”. Its main benefit is the timing of the entries as soon as the proper conditions are met. You should plan on monitoring all trades, and take control if needed. Also watch for trades taken near the end of the trading day, as they may not exit automatically!

Use Local Sim trading for learning the tools, Back Testing, and replaying a session. All trades are simulated by the platform, so network delays and exchange slippage is not real.

Use Live Sim Trading to have a more realistic trading environment where the network and exchange simulate fills, and you cannot reset the data.

Live Money trading is exactly what it says, and you should have practiced before starting it.

Note that you can always manually enter, adjust, or exit a trade. At no time does the Auto Trader lock you out from doing things manually.

[lgc_column grid=”50″ tablet_grid=”50″ mobile_grid=”100″ last=”false”]

Configure Local Sim Trading Configure Live Sim Trading Configure Live Money Trading Disable Live or SImulated Trading Tool Buttons to control Auto Trading

[/lgc_column]


S3 2.0 Setup

The Auto Trade chartbooks are divided into two charts: S3 with Volume Bars on the left (Chart #1) and S2 with Flex Renko / Heiken Ashi bars on the right (Chart #2).

The Size of the Volume Bars and the Flex-Renko bar settings are changed in the Chart Settings.

The charts are not sensitive to time zones, they are based on 24 hour days with no evening sessions.

When the Auto Trade software calculates when a valid Long Entry,  White Up arrows appear below bar, and when it finds a valid Short Entry, Yellow  Down arrows appear above the bar.

The entries that are indicated in the past are not real, the only indicate a trade would have taken place at that time if all Auto Trading switches are turned on. The only Arrows that will result in a trade entry are the ones that appear on the last bar to close. A Market Order will be submitted on the close of of the Signal bar if  the signal is present.

Click here to learn more about enabling Auto Trading in Sierra Chart:  Auto Trade Setup in Sierra Chart

Here is a summary of the Auto Trade controls:

Live or Live Sim: 

Needs Send Orders to Trade Service set to Yes 

Trade Simulation Mode On Unchecked.


Local Sim (PC simulation)

Needs Send Orders to Trade Service Set to No 

Trade Simulation Mode On Checked.


Trade Rules Settings

  1. For each chart, edit the Study Settings for: ID8: S3 Inputs (Horizontal Lines)
    1. MIN TICKS (Current bar must close at least this many ticks from previous bar). Impacts color bar study and auto trade.
    2. MAX TICKS (In order to be a possible valid entry bar, it must not have moved more than this number of ticks from the previous bar.
    3. Daily Max Loss Value: Stop Auto Trading if the PL for the day gets to or below this NEGATIVE number. This is Daily Loss Limit is Currency ($) without commissions.
    4. Daily Max Profit Value: Stop Auto Trading if the PL for the day gets to or above this POSITIVE number. The Daily Profit Limit is currency ($) without commissions.Note that the Auto Trade arrows will disappear after either MAX Value is reached. If you wish to continue to view the output (arrows) of the study, Simply disable Auto Trade for the Chart, then increase the number (or decrease the loss value if your net PL is negative) to view the arrows again.
    5. VWAP Rule: If this is set to 1, the VWAP rule is in effect. (No shorts if the last bar closes above the upper band of the VWAP study, no longs if below the lower band.) Default setting: 0.


Changing The Order Quantity

  1. In order to change the number of contracts traded, the S3 Inputs Study “Order Quantity Value” needs to be modified. If your attached order is for one contract, and you change the study value to two, it will make two entries with 1 contract each. You can modify your attached order to use 2 contracts, for example, one with a close target, and one with a runner. 
Modifying Trading Hours

Creating Custom Chartbooks

  • The Mega Bundle includes four templates for custom symbols. Open one of the S3 Custn yyymmzz.cht files and change the symbol on Chart #1, the S3 Vol Chart. Your new symbol will be applied to all relevant charts.
  • Save the file with the same name.
  • If you decide to save the file with a new name, then you should make sure you don’t use the same Custn chartbook for another symbol, as the SCSS will will be associated with two chartbooks, and that could cause problems.


S3 2.0 Installation

  1. In Sierra Chart determine the Data folder location by opening Global Settings>General Settings>General 1>Data Files Folder.

    Transact Futures changes the default location
  2. The path should already be selected (highlighted). Copy the Path by right clicking and selecting Copy.
  3. Download the Zip file to any folder.
  4. Open the Zip file by double clicking on it
  5. Run the setup.exe file.
  6. Click I accept the agreement.
  7. Click Next
  8. In the box where it says Select Destination Location, right-click and Paste the path you copied from Sierra. You may also Browse to the location.
  9. To the Folder Exists Dialog box: Click Yes.
  10. Click Install
  11. Click Finish
  12. Go Into Sierra Chart and File>>Open Chartbook and pick one of the S3 xx yyymmdd.cht files.

S3 2.0 Features

Features of the Auto Trade Chartbooks

  1. Flexible rules for implementing the study on any symbol.
    1. The min and max tick movements required to be a valid entry are adjustable by the user.
  2. Attached orders are supported. Set targets and stops as you like.
  3. Adjustable order quantities, default is 1. (Even if you change the attached order. See “Changing the Order Quantity” in Setup.
  4. User selectable daily maximum profit and loss limits. Auto trade will stop for the day if either of these are hit.
    Defaults:

    1. Daily Max Profit: $100
    2. Daily Max Loss: ($100)
  5. Optional rule to not enter below (long)/above (short) VWAP.
  6. Option to disable the Moving Average Exit cross rule for backwards compatibility with S3 v 1.0.
  7. Any type of candle can be used: Volume Bars are the default. A Volume Bar consists of x (e.g. 3000) contracts before closing and creating a new bar. The number x is set in the chart settings.
  8. The last bar’s volume countdown to zero is displayed on the chart.
  9. Volume Bar and Flex Renko Heiken Ashi bar charts in the same chartbook, allowing the selective trading of two strategies based on market conditions.
  10. S3 M8 charts have 8 symbols in one chartbook. These are set to monitor trades from other charts, but they can also be enabled to auto-trade as a live dashboard. In support of Live Trading Challenges, the total number of open positions across the 8 symbols is displayed in the upper left window. This is a read only display and is not configured to prevent trading beyond any maximum limit.

The S3 Strategy

The S3 Basic System Strategy is as follows.

  1. Crossover Rule:
    1. When the 8 EMA crosses above the T3-8 MA, we are looking for long entries.
    2. When the 8 EMA crosses below the T3-8 MA, we are looking for short entries.
  2. T3 Rule:
    1. Setup Long when a candle closes above the T3-8 MA
    2. Setup Short when a candle closes below the T3-8 MA
  3. Signal Rule:
    1. Long: On the next candle following a candle that meets the T3 Rule Setup, a Cyan color bar is one that closes a minimum number (e.g. 5) of ticks, and no more than a maximum number of ticks (e.g. 24) above the previous Setup Candle. A Dark Cyan candle is one that exceeds the maximum number of ticks, but otherwise meets the basic rules.
    2. Short: On the next candle following a candle that meets the T3 Rule Setup, a Magenta color bar is one that closes a minimum number (e.g. 5) of ticks, and no more than a maximum number of ticks (e.g. 24) above the previous Setup Candle. A Dark Magenta candle is one that exceeds the maximum number of ticks, but otherwise meets the basic rules.
Figure 1. An example of the Basic Strategy.

Looking at the chart in Figure 1, one could take an entry after the close of any of the colored bars, and many would work out OK. However, to improve the probability of a profitable trade, two new rules were added. These Enhanced Rules require that the T3-8 slope be in sync with the direction of the trade, and limits the number of entries to 1 per crossover, to help avoid losing trades at the end of a trend.

The S3 Enhanced System Strategy (starting with Cyan and Magenta bars from the Basic Strategy) adds additional rules to filter out some trades:


  1. T3-8 Slope Rule:
    1. Long: Cyan Bar must appear with a positive (White) sloping T3-8 Moving Average.
    2. Short: Magenta Bar must appear with a negative (Red) sloping T3-8 Moving Average.
  2. First Candle Rule:
    1. Long: Enter a Buy Market Order after the close of the first Cyan Candle after the 8 EMA cross over from below the T3-8 MA that meets the T3-8 slope rule.
    2. Short: Enter a Sell Market Order after the first Magenta Candle after the 8 EMA cross over from above the T3-8 MA that meets the T3-8 slope rule.
  3. Optional VWAP Rule:
    1. Long: Only if above the Daily VWAP.
    2. Short: Only if below the Daily VWAP.
Figure 2. The Basic and Enhanced Rules together

In Figure 2, we see white and yellow arrows. These indicate where the Auto Trade study, following the additional Enhanced rules, would make trade entries. The Long entries are White Up Arrows and the Short Entries are Yellow Down Arrows. In this example, the enhanced rules reduce the number of possible trades in the Basic Strategy from 27 (the number of cyan and magenta bars) to 8. While this is a fairly choppy time period, most of these trades would have worked out OK, providing the target is not too far from the entry. You can see there are bars that would have been OK, but they don’t meet the T3 slope rule.


Exit Rules

  1. T3 Cross:
    1. Long: Exit when price action closes below the T3 MA or when 8 EMA Crosses T3-8 MA from above.
    2. Short: Exit when price action closes above the T3 MA or when 8 EMA Crosses T3-8 MA from below.
  2. Target Hit
  3. Stop Hit
  4. Manually Flatten

Why two strategies?

The Basic strategy is easily implemented in Sierra Chart using the Color Bar Based on Alert study. For every bar it looks at the previous bar to see if it closed above the T3 study. It also looks at the current bar, to see if it closed far enough away from the previous close.  Users who purchased the Manual Chartbooks will only see these bars and will need to follow the Enhanced rules in their head, deciding visually if a bar is the first bar to close after the crossover that is also in sync with the slope of the T3.

The Enhanced rules require more complex formulas to count bars and compare them to moving average crossovers and the slope of the T3 MA. The Spreadsheet Study for Trading enables these rules, as well as managing the trade entries and exits.

S3 Scalping System – Introduction

The S3 Scalping System for Sierra Charts is designed to identify scalping entries and exits with the goal of reaching a daily profit level. It can be used during trending and ranging conditions, as its goal is to identify short term changes in momentum and quickly enter and exit when a target is reached. It is not meant to be traded all day long, but to capture moves during the first few hours of the trading day when volume is high.

The S3 Chart Trading System is entirely rule based and it comes in two versions: Manual and Auto Trade. The Manual Version includes the Basic Chartbooks. It is strictly for manual trading, and it shows potential entries, based a Basic set of rules. The user can make the decision to enter, using some additional Enhanced rules, provided below, that he will need to follow.

The Auto Trade Version adds to the Basic Chartbooks a Spreadsheet System for Trading Study that has been coded to implement the Basic rules, as well as the Enhanced Rules, and to enter the trade for you as soon as the signal appears, or just signal when you could enter a trade manually.

With the optional S3 Spreadsheet System for Trading, the S3 Scalping System becomes a completely automated trading solution. It fully implements the S3 trading strategy, including the Basic and Enhanced rules. Daily profit and loss targets can be set on a chart by chart basis, as trading conditions change throughout the day, and one can decide to adjust or exit a trade at any time.

The user has complete control, including which charts/symbols to trade, order quantities, adjustments to the rules, targets, stops, and daily limits.


S3 2.0 Auto Trader

[lgc_column grid=”100″ tablet_grid=”100″ mobile_grid=”100″ last=”false”]

Introduction Features The S3 Strategy Installation Setup Sierra Chart Tick and Time Zone Setup Changing Session Times Changing the Order Qty Cloning Chartbooks

[/lgc_column]


U.S. Government Required Disclaimer – Commodity Futures Trading Commission states: Futures and Options trading has large potential rewards, but also large potential risk. You must be aware of the risks and be willing to accept them in order to invest in the futures and options markets. Don’t trade with money you can’t afford to lose. This is neither a solicitation nor an offer to Buy/Sell futures, stocks or options on the same. No representation is being made that any account will or is likely to achieve profits or losses similar to those discussed in this document. The past performance of any trading system or methodology is not necessarily indicative of future results.