Strategy
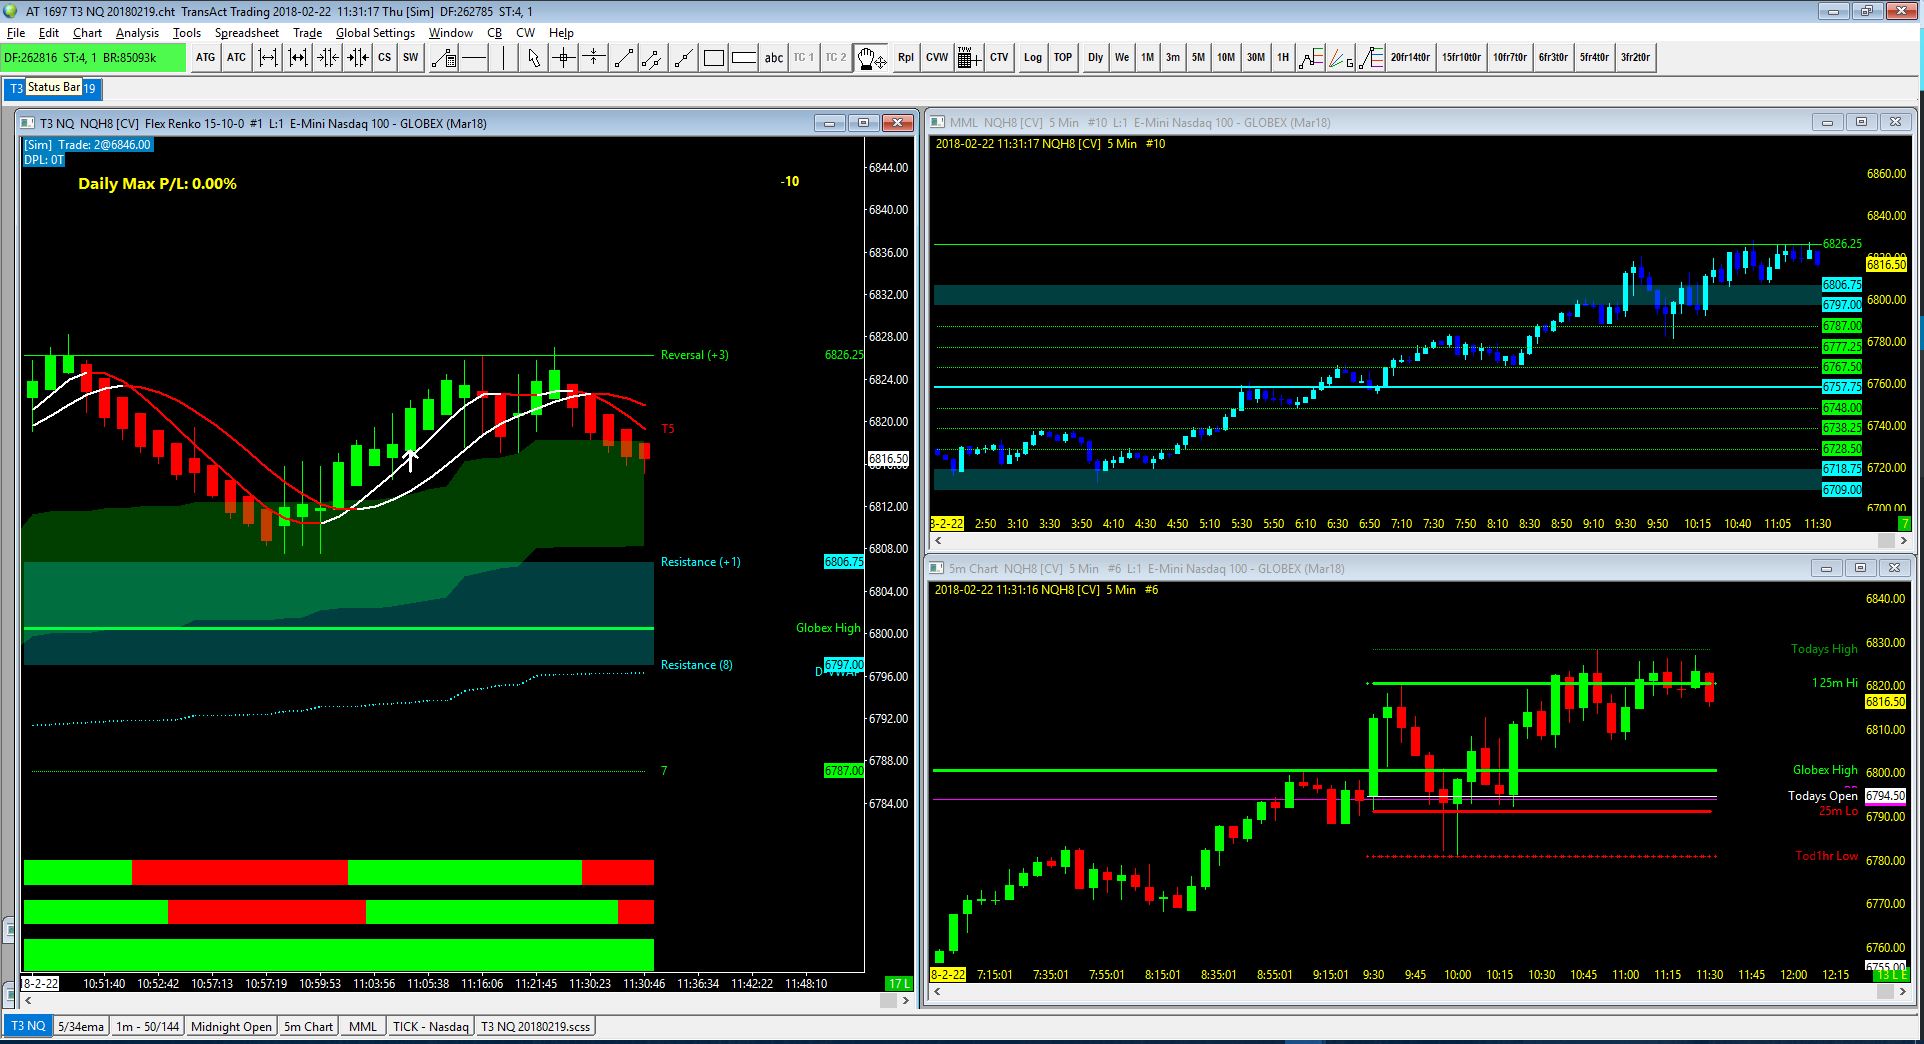
The S3 Strategy is here, and the T3 Strategy is here. Chart #1 is the S3 chart. It is basically the S3 strategy with the additional colorbars carried over from the T3 chart. The colors should match, even if the durations of each look different. When the T3 chart is all green, the S3 will also be all green. You can use this T3 confirmation as a way to help you decide if you want to auto trade on S3 or not.
Installation
- Download the zip file.
- On Windows, you don’t need to extract the files, merely open the zip file and Windows will treat it like a compressed folder.
- Run the enclosed S3T3 Setup.exe.
- Accept the License Agreement and click Next
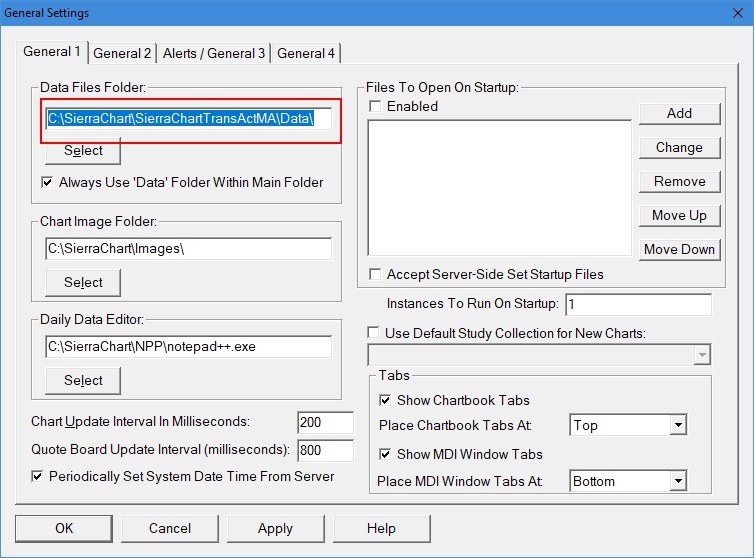
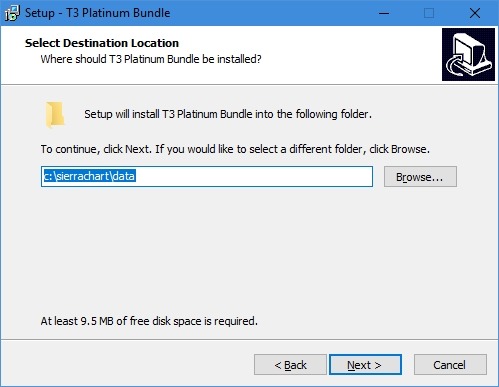
- Confirm the correct data folder for your setup and click next. (Infinity uses C:\SierraChart\SierraChartTransActMA\Data\)
- Click yes to Folder Exists.
- Click Install
- Click Finish
Setup
The S3 settings are in the “S3 Inputs” study of the S3 chart.
- Min Ticks Value: This is the minimum number of ticks the bar has to close away from the previous close to be considered for a possible entry default for NQ/YM/RTY is 5. ES is 2.
- Max Ticks Value: This the maximum number of ticks the bar has to close away from the previous close to be considered for a possible entry default for NQ/YM/RTY is 24. ES is 10.
- Daily Max Loss Value: Set this to a negative number indicating the most ($) you are willing to lose in a day before the auto trader stops trading.
- Daily Max Profit Value: Set this to a positive number indicating the most ($) you are willing to win in a day before the auto trader stops trading.
- VWAP Rule Value: If set to 1 the VWAP rule is in effect, meaning only trade long above VWAP and only trade short below VWAP. Default is 0.
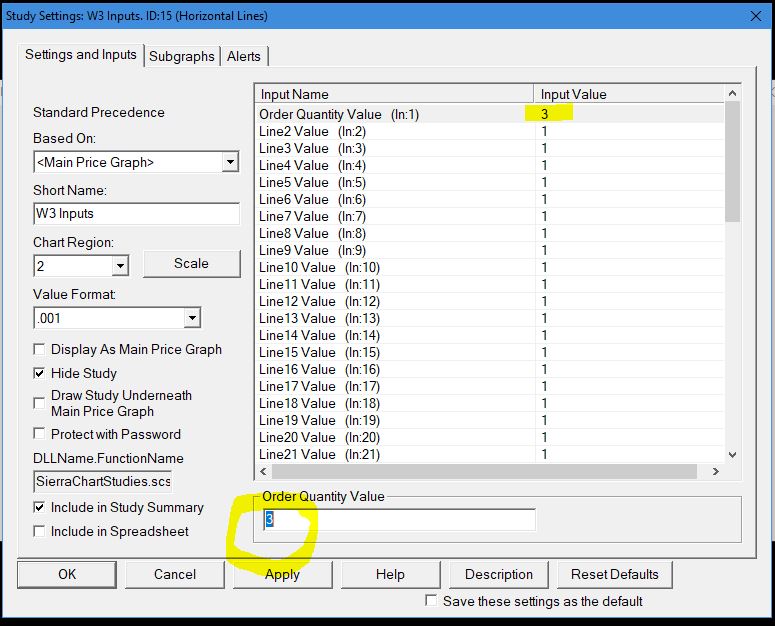
- Order Quantity Value: Change this is you want to trade more than one contract. Note that the attached order trade management should also match this value. For example, if you set this to 2, and leave the attached orders at 1, the auto trader will enter two trades of one contract each.
- Crossover Rule Value: This is a feature that has not been implemented in this chart.
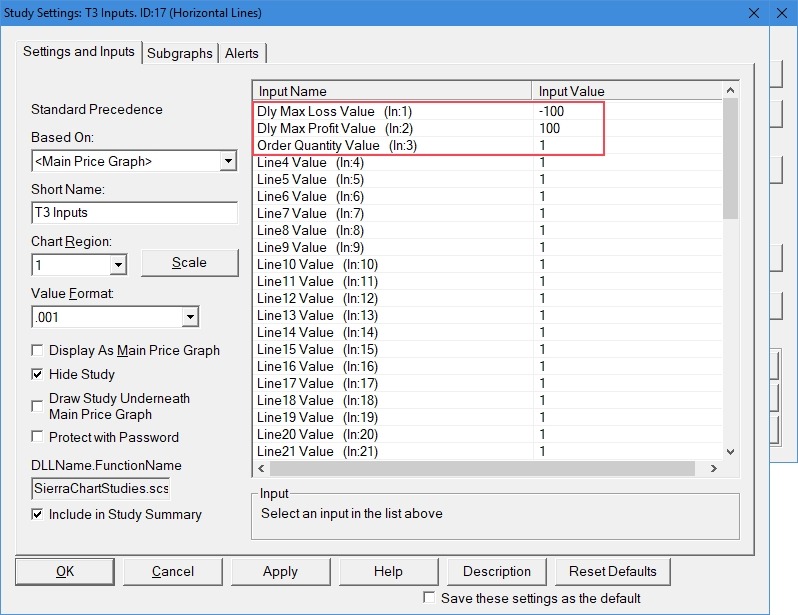
The T3 Settings are in the “T3 Inputs” Study of the T3 chart.
- Daily Max Loss Value: Set this to a negative number indicating the most ($) you are willing to lose in a day before the auto trader stops trading.
- Daily Max Profit Value: Set this to a positive number indicating the most ($) you are willing to win in a day before the auto trader stops trading.
- Order Quantity Value: Change this is you want to trade more than one contract. Note that the attached order trade management should also match this value. For example, if you set this to 2, and leave the attached orders at 1, the auto trader will enter two trades of one contract each.
The S3T3 Auto Trader uses a Quote Board to select symbols. This allows you to easily switch between symbols. The Tick is also selectable. To change values, click on the one you want, and the charts that are linked to the board will be updated. To add a new symbol, double click on an empty space, enter the value, and click OK.
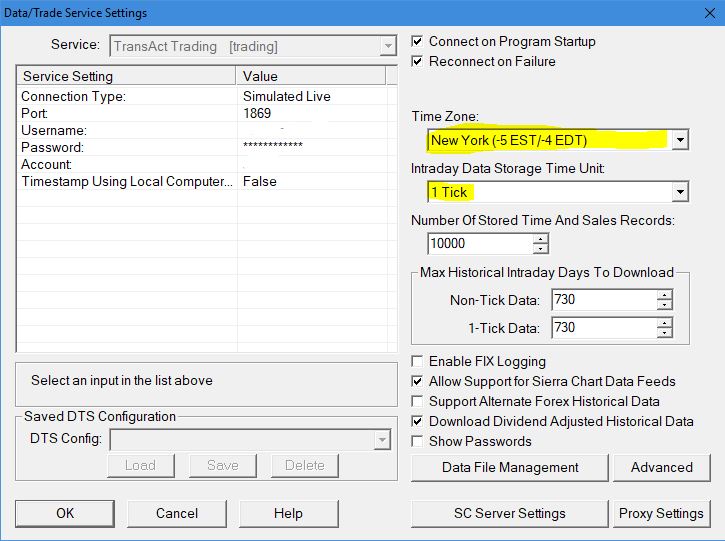
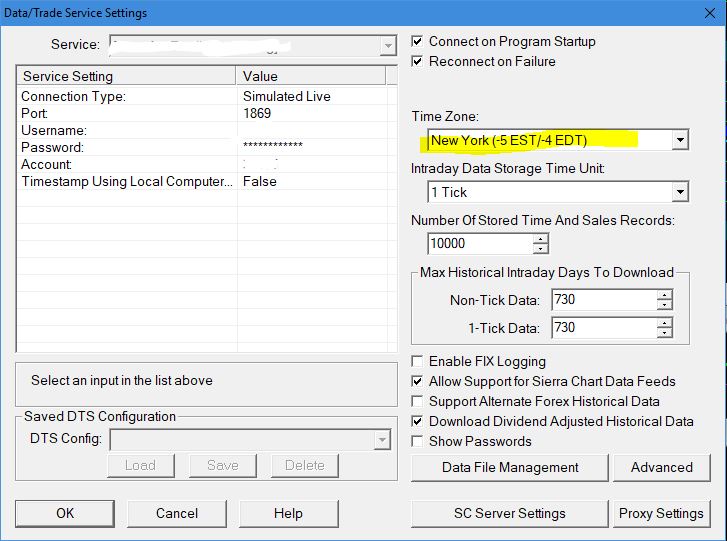
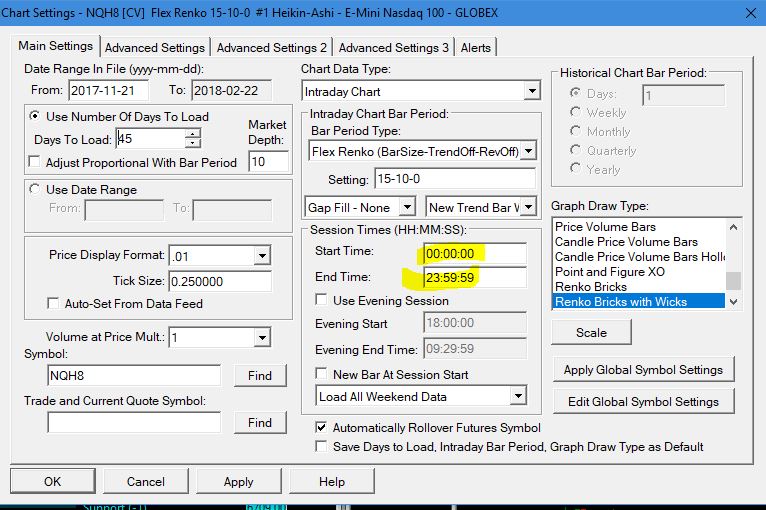
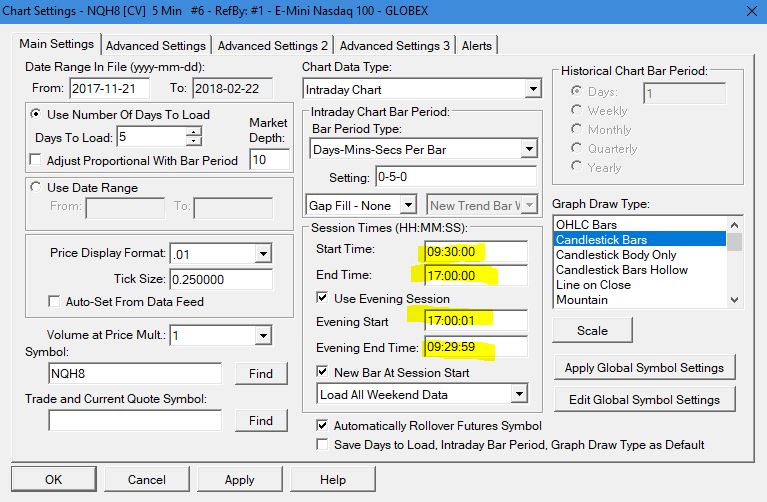
If you are not trading in the New York time zone, then your overlays (Globex, VWAP, etc. come from other charts) will have bad data. The overlay study doesn’t adjust for time zones, so the value at noon in New York is the same as the value at noon in Los Angeles, which is obviously incorrect. All charts in the W3 chartbook are set to New York time, so this may make the times look different than your local time. You may want to set your Global Time Zone to New York to make sure you don’t have this problem on older charts that have not been updated yet.
Cloning Chartbooks
If you want to keep multiple copies of the S3T3 chartbook, it is not enough to save the chartbook with a new name. Go here to see how to make copies of the complete package.