Sierra Chart custom studies are ideal for mechanical trading systems due to their robustness and speed.
This is my development process:
1. Requirements: You provide your criteria, including entry/exit rules, risk management, and any other specifics, ideally in logical or mathematical terms.
2. Review: I’ll review your requirements and seek clarification if needed.
3. Quote: Once we agree on the scope, I’ll provide a fixed-price quote and estimated turnaround time. Additional charges apply for source code or multiple users.
4. Approval: Upon acceptance, you’ll pay 50% upfront.
5. Development: I’ll begin work and notify you when it’s ready for beta testing, distributing files to your Sierra Account automatically.
6. Beta Testing: You’ll test within a reasonable timeframe, reporting any bugs for correction. This process repeats until satisfied.
7. Final Approval: You approve the beta and pay the remaining balance. The source code, if purchased, is delivered.
8. Support: One year of email support is included; thereafter, standard consulting fees apply.
The FC Risk Management / Lockout Tool has various ways that can lock all trading with the broker. This includes flattening, canceling, or modifying.
What can go wrong?
If you are in a trade you want to exit, you cannot do it the normal way when trading is locked. That’s where the emergency button comes in.
If you are in a situation where you want to exit all trades, the Emergency Flatten button will temporarily unlock trading, flatten and cancel all orders, and then lock trading again.
Here are three reasons why it may not be working:
1. Did you enable Auto-Trading Global and Auto-Trading Chart on the chart with the Lockout Tool?
– Anytime a study does trading for you these have to be enabled.
2. Does the ACS Control Bar Button match the ACS number in the study settings?
3. Did you select the chart you want to flatten the trade on before clicking the button?
– Only the chart with the Lockout Tool can see the button and act on i
When it works you will see the following messages in the Windows Message Log:
Emergency Flatten 10: Trading Unlocked
Emergency Flatten 20: Flatten and Cancel All Orders submitted
Emergency Flatten 3a: Trading Locked
If Unsuccessful, you will see this message:
Emergency Flatten 21: Flatten and Cancel Error nnn
Where nnn is an error code.
Some studies can be controlled with Advanced Custom Study Button. Each one is assigned a number from 1-150. The Study can interact with the button by changing the text label and checking the state of the button. If the button is in, it is On, if it is out, the button is off. You can change what button number a study will use in the study settings.
First, you need to know which ACS number you want to use. This will be in the study settings.
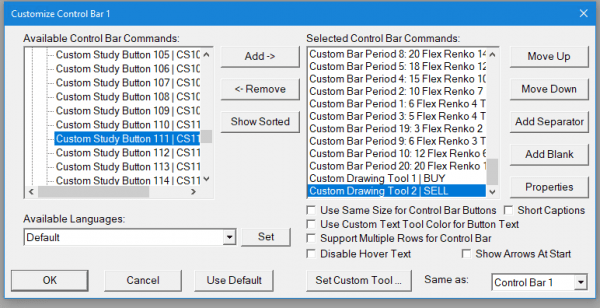
In this example, we want to add ACS Button 111 to Control Bar 1
To do this click Global Settings>>Customize Control Bars>> Control Bar 1 (or whichever one you are using).
On the left scroll down to Advanced Custom Study Buttons and click the “+” sign to expand the list:
Find the Custom Study for the Number you need to use, on the left. On the right side, select where to insert the button on the list. The lower you put it on the list, the farther to the right the button will appear. I will put it on the bottom so it will be on the far right.
Note that the button captions and description text will be provided by the study when that chart is selected, so you don’t need to do anything with the properties, unless you want to change any of the other properties, such as the size of the font.
Click Add-> and click OK. You should see this on the far right of the Control Bar.
Note that the button captions and description text will be provided by the study when that chart is selected, so you don’t need to do anything with the properties, unless you want to change any of the other properties.
The Trade Activity Log has a log entry of every activity that enters, modifies, or closes orders. If it was part of a message to the exchange about an order, then it is recorded in the TAL. The log should be filtered to view the relevant trades. There are three Steps to sending the log: Preparing, Saving, and Attaching the log.
Preparing the Log
The following steps will generate the log for the specific trades you are interested in.
Select Trade >> Trade Activity Log on the main Sierra Chart menu.
Click DisplaySettings
Set Trade Activity Type to All Activitys.
Symbol List All Symbols or the specific Symbol Traded
Trade Account: [Select the account the chart is set to e.g. Sim1]
Simulation State: If the trade used a
Sim Account Select Simulated
Live Account Select Non-Simulated
To Date-Time is Today: Yes
Click Apply All.
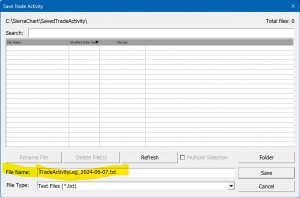
Saving the Log
On the Trade Activity Log window, select the [*Trade Activity] tab from the menu. The log file can now be saved as a file for emailing and analysis.
In the Trade Activity Log window, select File>> Save Log As and use the default name as it contains the date the file is saved:
If you need to send more than one file per day, just add a dash and a number:
Click Save.
Email the Log
In your email program, attach the file located at: C:\SierraChart\SavedTradeActivity. If you sort the files by date, it will be the newest one. Then send the file as an email attachment to mailto://support@forgivingcomputers.com
4. Sending the Trade Service Log
The Trade Service Log records certain messages between the application and the trade service. If an auto-trading system is not performing as expected, there may be an error message in the Trade Service Log that can help pinpoint the source of the problem.
In the Sierra Chart Menu: Trade>>Trade Service Log
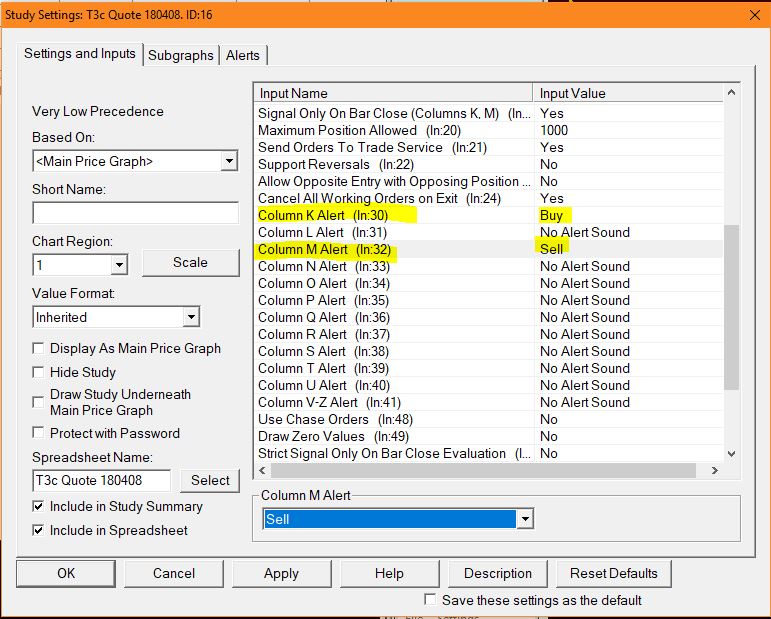
The S3 auto trade study is ID5, the T3 auto trade study is ID16, and the W3 auto trade study is ID3. For example, you can add an audio alert to the T3 Auto Trade study by editing the Study Settings for ID16. Column K is Buy Long, and Column M is Sell Short.
If you want to add sound files to the list of available alerts, the files should be saved in the C:\SierraChart\AlertSounds. (For Infinity/Transact Futures the folder is: C:\SierraChart\SierraChartTransActMA\AlertSounds.) Go to Global Settings>>General Settings>>Alerts/General 3 to add sound files to the list of available audio alerts.
Dell wants to sell me new memory chips to help speed up computer processing, not sure that will do it.
Unless the computer came with slower chips than it was designed for, swapping out faster ones will not make a difference. I don’t think Dell would have done that. What will help is if you upgrade to more RAM, as Windows will spend less time swapping data back and forth to the disk drive. You can go to Crucial.com and run a test that will tell you what your options are. Dell will sell computers with less than the maximum amount of RAM allowed to allow for upgrade but save money in the initial purchase.
The best way to speed up Sierra Chart without buying a new computer would be to run Sierra Chart on a Solid State Drive SSDs don’t have moving parts as they are totally electronic, making them much faster. Most SSDs come with software for cloning your existing hard drive, which you can save as a backup.
Also reducing the amount of open chartbooks, and the number data/days that the chart loads on start-up will help. If you don’t normally run backtests or look back on your charts more than 7 days. There is really no need to have your charts set to load more than 10 days of data.
With regular use, the Sierra Chart data folder (C:\sierrachart\data) will continue to grow in size over time. The reason is that all chart data from the first Intraday chart viewed until the present is based on *.scid files. There is one per symbol.
If disk space is a concern, the easiest thing to do is to delete all the scid file and Sierra will download any missing data the next time you open a chart that needs it. This is the equivalent of doing Edit>>Delete All Data and Download.
The easiest way to get rid of unused downloaded data is to close Sierra Chart and delete all the *.scid files in the C:\sierrachart\data folder. When you open any chartbook, it will download fresh data if it cannot be found on your system.
Yes. By default it resets at midnight according to the Time Zone setting in Sierra Chart. The reset time can be changed through Global Settings >> General Trade Settings >> Daily Stats Reset Time.
Your trade service uses different symbols than the ones that have been provided. Go into Chart Settings, Main Settings and select the FIND button next to the Symbol: box. You can search for the correct symbol or if you know it, just type it into the Symbol: box.
For example, if the chart settings are using the symbol NQM8, and it is listed as Unknown, you may have to enter something like F.US.ENQM18 if you use AMP as a broker.
In general, no. You only need to save the spreadsheet if you made changes to it, and haven’t saved it yet. Nothing needs to be changed in the spreadsheets. Otherwise you can say No. Changing the values in the Constants Study does not count as changing the Spreadsheet, as they will be reloaded the next time the chartbook is opened.
The most common reason for this is your data feed doesn’t recognize the format of the symbol name. Do Edit>>Translate Symbols to Current Service
Another reason may be that you have exceeded the daily Maximum Profit or Loss for the chart. If the Daily Max P/L % is either > 100% or < -100%, then increase the limits in S3 Inputs (or T3 or W3 inputs as the case may be.)
Necessary cookies help make a website usable by enabling basic functions like page navigation and access to secure areas of the website. The website cannot function properly without these cookies.
We do not use cookies of this type.
Marketing cookies are used to track visitors across websites. The intention is to display ads that are relevant and engaging for the individual user and thereby more valuable for publishers and third party advertisers.
We do not use cookies of this type.
Analytics cookies help website owners to understand how visitors interact with websites by collecting and reporting information anonymously.
We do not use cookies of this type.
Preference cookies enable a website to remember information that changes the way the website behaves or looks, like your preferred language or the region that you are in.
We do not use cookies of this type.
Unclassified cookies are cookies that we are in the process of classifying, together with the providers of individual cookies.
We do not use cookies of this type.
Cookies are small text files that can be used by websites to make a user's experience more efficient. The law states that we can store cookies on your device if they are strictly necessary for the operation of this site. For all other types of cookies we need your permission. This site uses different types of cookies. Some cookies are placed by third party services that appear on our pages.