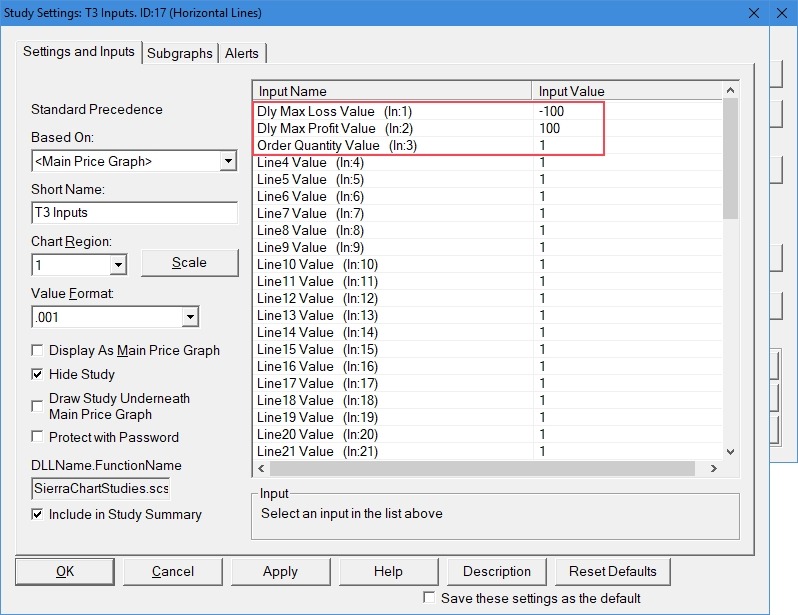
The T3 Inputs Study controls the Maximum Daily Profit and Loss numbers, and the Order Quantity. When the Max Daily loss or profit number is reached, auto trading will cease, and the arrows will disappear from the chart.
To adjust the T3 Inputs, Right-Click on the T3 Chart and select Studies.
Select the T3 Inputs Study and click Settings (or Double Click on the study).
Dly Max Loss Value: Set this to a negative number. Auto trader will stop for the day if your losses are at least this much. Also used in the Daily PL Progress calculations.
Dly Max Profit Value: Set this to a positive number. Auto trader will stop for the day if your profits are at least this high. Also used in the Daily PL Progress calculations.
Order Quantity Value: This is the number of contracts the auto trader will enter into. Note if this number is greater than the number of contracts in the attached order, then the attached order will get filled more than once.
If you are trading in a time zone that is different from New York (EST/EDT), then you may want to change Session Times in some of the charts. Note that this is an optional step, and with the exception of the S3 VWAP* rule, it does not impact any of the auto trading rules. It will help you be consistent with other traders, so you will know you are all looking at the same thing.
Many of the charts are 24 hour charts, which means their session starts at midnight (00:00:00). By default this is Midnight in New York.
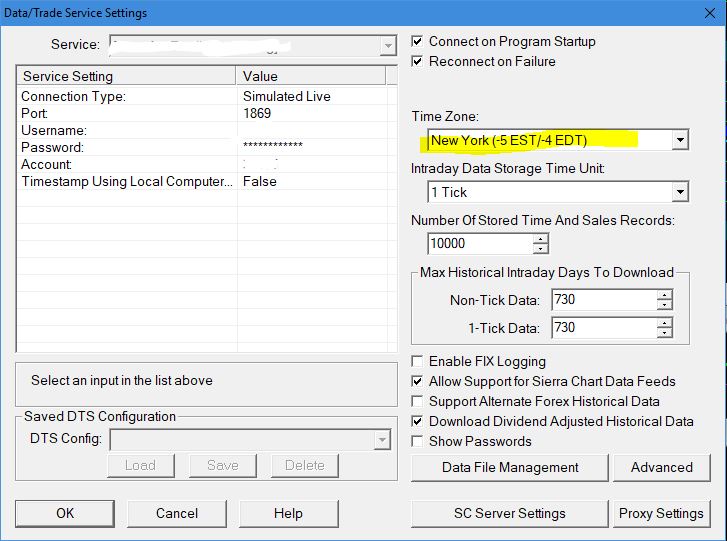
The easiest way to fix this across all S3 and T3 chartbooks, as well as chartbooks downloaded from the TradingFibz shared drive is to simply tell Sierra Chart that you want to trade in New York time. Go to Global Settings>>Data/Trade Service Settings and change the Time Zone to New York (-5 EST/-4 EDT):
Setting Sierra Chart to New York Time.
Of course, depending on where you live this might take some getting used to.
This web site can help you determine market hours around the globe, and it is tied to your PC’s time zone, which should be set to where you are: https://market24hclock.com/
Should you decide you want to adjust the charts to match your trading time zone, you open the chart settings and set the session times.
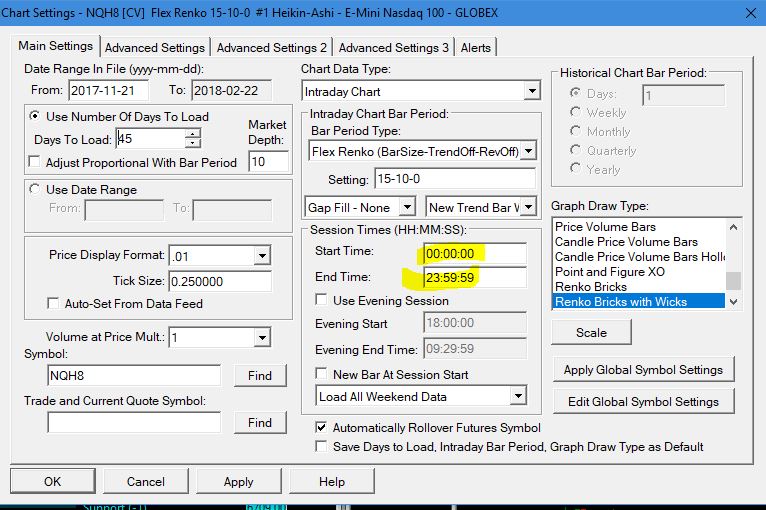
24 hour Chart:
This is the chart settting from the T3 chart:
24 Hour Chart
Change the highlighted times to your local time when it is midnight in New York. For example, if you live in London, and trade in London Time, then New York is 5 hours behind, so when it is 05:00:00 in London, it is midnight in New York. So you would change Start Time to 05:00:00 and End Time to 04:59:59.
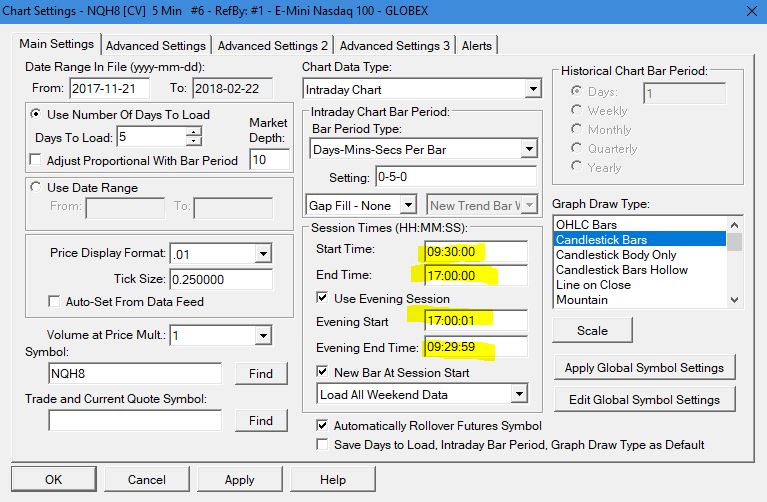
For charts that are based on RTH (Regular Trading Hours) or if there are evening sessions, add or subtract the appropriate number of hours depending on your trading time zone.
Adjust the session times for your trading time zone.
* The VWAP study resets at Midnight, so the reset will depend on which time zone you are in. You want it to reset at Midnight New York time, so the S3 charts that use the VWAP rule (which by default is disabled) should change if you plan on using it.
In the end, you should ask yourself if it is worth the trouble of changing your charts, or if you should just get your head around trading in New York time.
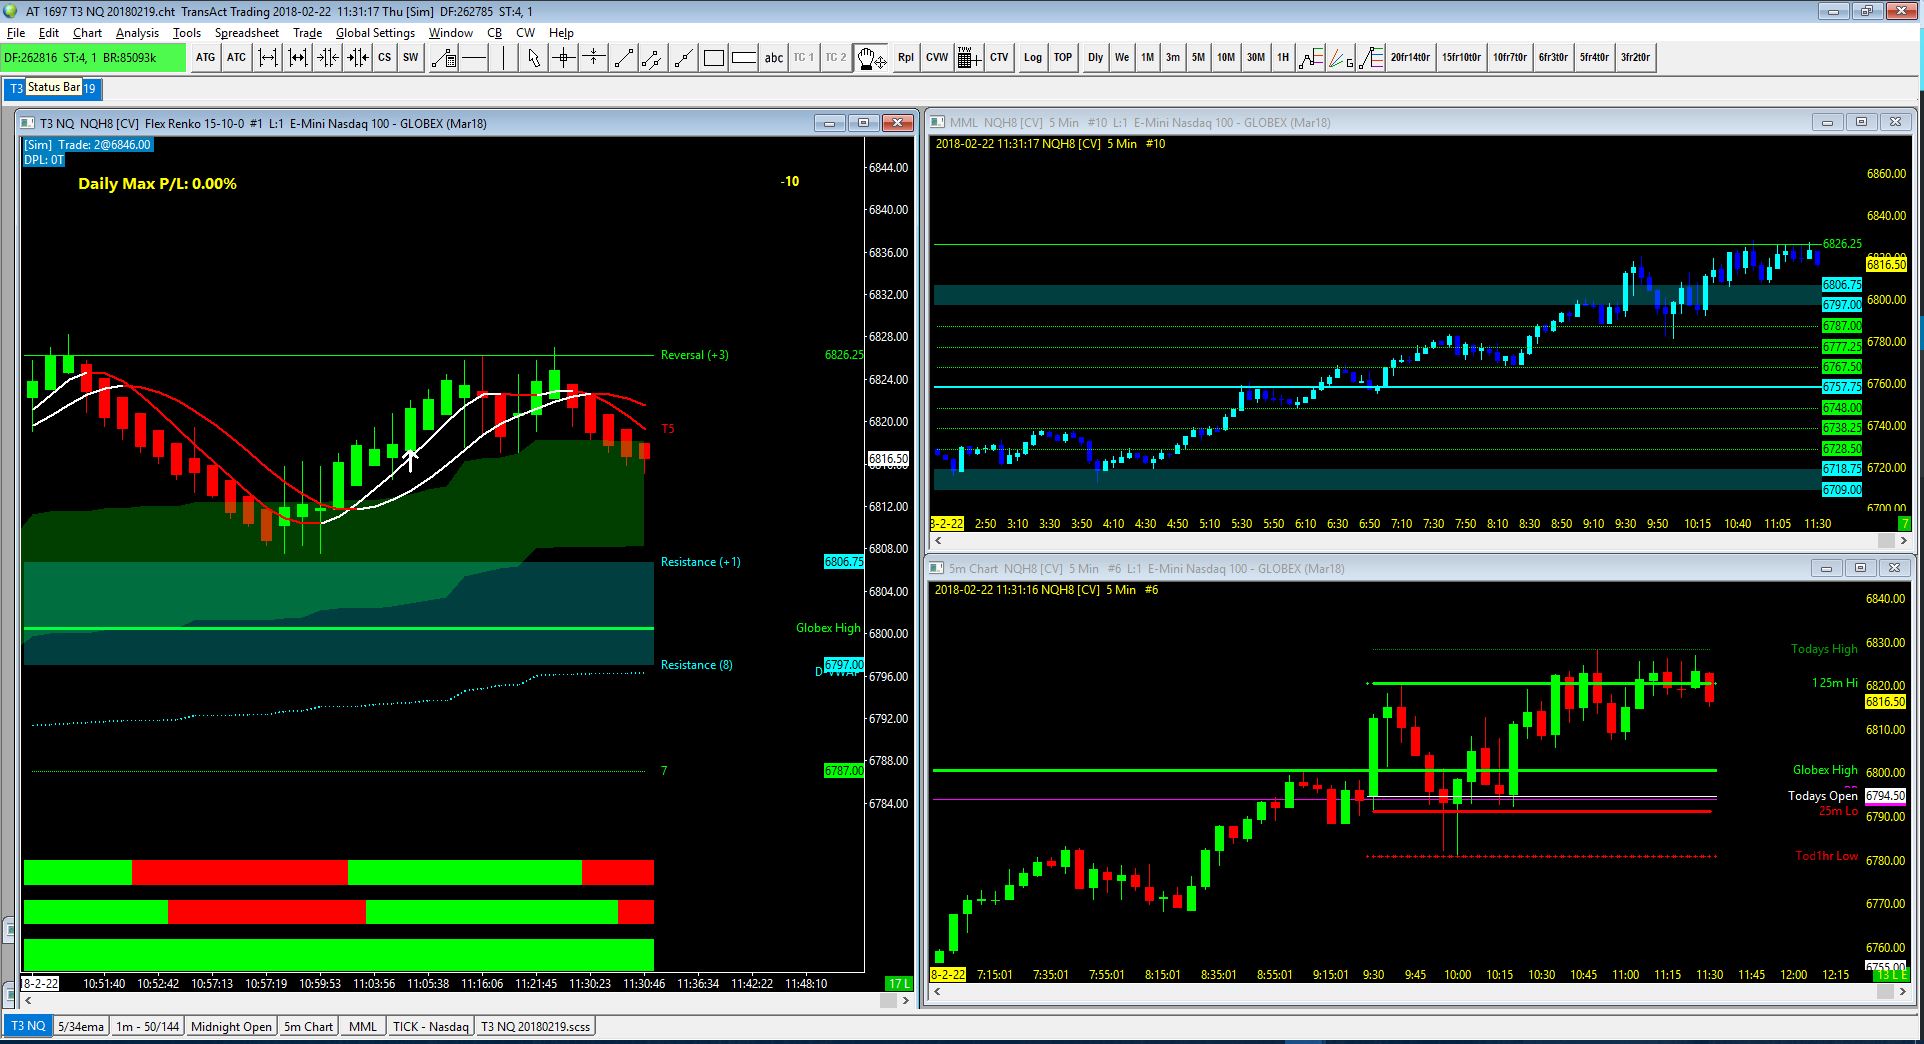
The charts are a follows starting from the left and going clockwise:
T3 NQ: The main chart for trading.
The candles are Flex Renko with the Heiken Ashi study applied to them.
The Green cloud is the overlay from the hidden 1 min chart of the 50 and 144 exponential moving averages. When it is Green the 50 ema is above the 144 ema.
The Blue band indicates two of the MML Resistance levels overlaid from the MML chart.
In the upper right is the NASDAQ Tick value overlaid from the TICK-NASDAQ chart, which is hidden.
The upper displays the progress towards the daily PL goals. Positive means a net Profit, Negative means a net Loss. (Note: Commissions are not included.)
The three colored bars at the bottom are from top to bottom:
T3-5 / T3-8: Green means T3-5 is above T3-8. One requirement for a long entry.
5/34 EMA: Overlaid from the hidden 5/34 EMA chart. Green means the 5 is above the 34.
50/144: Overlaid from the 1 min chart. Green means the 50 EMA is above the 144. Corresponds to the color of the 50/144 cloud.
MML: This is a the 5 minute Murrey Math Levels chart. It is not part of the auto trader rule set. You may want to watch it for possible reversals and disable auto-trading at key levels. The chart is overlaid onto the T3 chart. You may want to change the period of the MML chart or the “Square Width” of the MML Mod study.
5 Min chart: This is provided with several key levels. If you are not trading in the New York (EST), you may want to adjust the hours so you get consistent results. (See Changing Session Times)
Hidden Charts: You can view these, but they should remain minimized as they are providing information to other visible charts.
5/34 EMA: Same time frame as the T3 chart. Changing the time frame or symbol on the T3 chart changes this one too. Provides the region 3 background colors.
1m – 50/144: A time based chart, with two MAs that get overlaid as the cloud on the T3 chart.
Midnight Open: The start of a new trading day.
Tick-xxxx: This is provided on chartbooks for the Stock Index futures (ES, NQ, YM and RTY). It provides the tick text data in the upper right of the T3 chart.
T3 xx yyymmdd.scss: This is the Spreadsheet Study for Trading that controls the auto trading logic. You normally do not need to touch this. Nor do you need to save it when asked. You do need to take extra steps if you want to clone a chart book. See instructions here.
Creating Custom Chartbooks
The Mega Bundle includes four templates for custom symbols. Open one of the T3 Custn yyymmzz.cht files and change the symbol on Chart #1, the T3 Chart. Your new symbol will be applied to all relevant charts.
Save the file with the same name.
If you decide to save the file with a new name, then you should make sure you don’t use the same Custn chartbook for another symbol, as the SCSS will will be associated with two chartbooks, and that could cause problems.
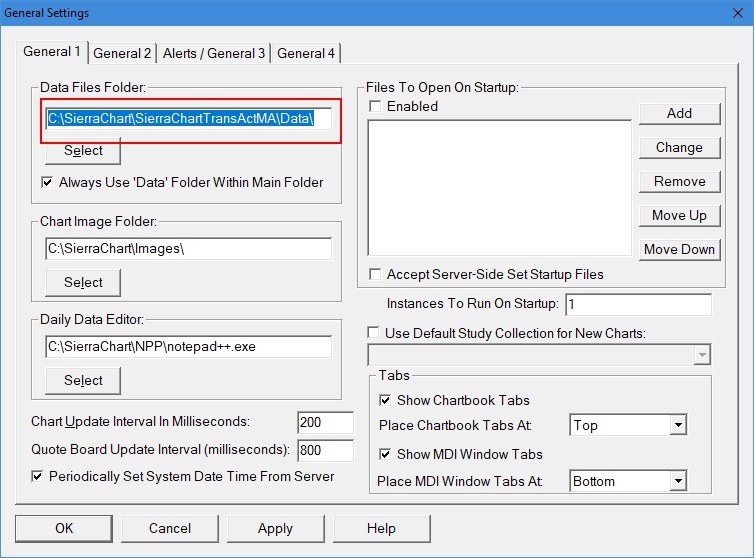
In Sierra Chart determine the Data folder location by opening Global Settings>General Settings>General 1>Data Files Folder. Transact Futures changes the default location
The path should already be selected (highlighted). Copy the Path by right clicking and selecting Copy.
Download the Zip file to any folder.
Open the Zip file by double clicking on it
Run the setup.exe file.
Click I accept the agreement.
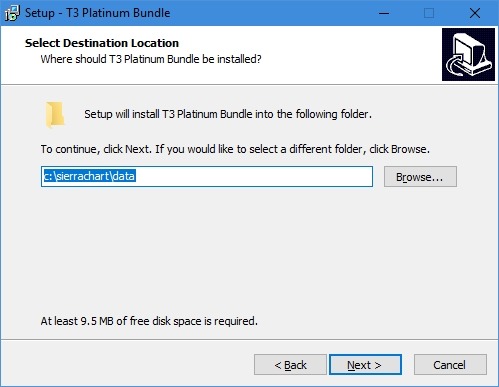
Click Next
In the box where it says Select Destination Location, right-click and Paste the path you copied from Sierra. You may also Browse to the location.
To the Folder Exists Dialog box: Click Yes.
Click Install
Click Finish
Go Into Sierra Chart and File>>Open Chartbook and pick one of the T3 xx yyymmdd.cht files.
Adjustable Flex Renko Time frames. Some markets move faster than others, so for the ES market, a 5-4-0 setting is used. For NQ, 10-7-0 or 15-14-0 is used. Every market has an ideal setting at any point in time.
Attached orders are supported. Set targets and stops as you like.
Order quantity can be modified to allow for multicontract trades.
Adjustable order quantities, default is 1. (Even if you change the attached order. See “Changing the Order Quantity” in Setup.
User selectable daily maximum profit and loss limits. Auto trade will stop for the day if either of these are hit.
Defaults:
Daily Max Profit: $100
Daily Max Loss: ($100)
5 minute charts for Murrey Math Levels (MML) and other popular levels.
The T3 Trading Rules are the core strategy of the TradingFibz.com trading room, run by David Katz. It is based on a combination of Flex Renko Heiken Ashi bars, moving averages, and overlays from other time periods. The detailed rules are here.
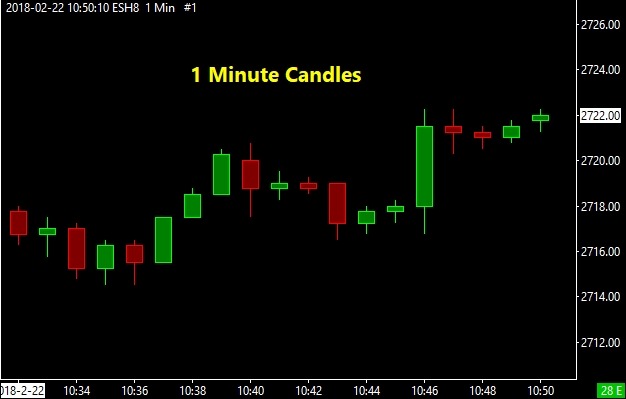
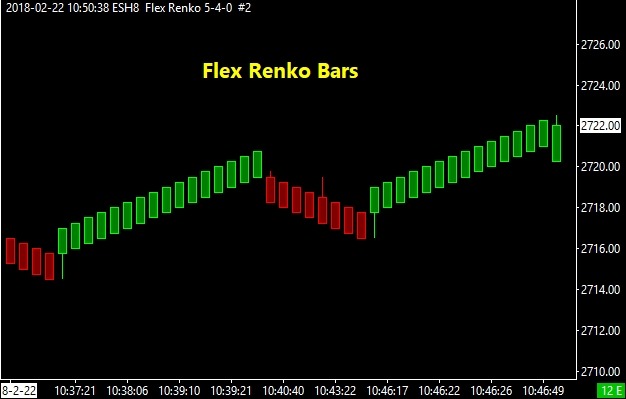
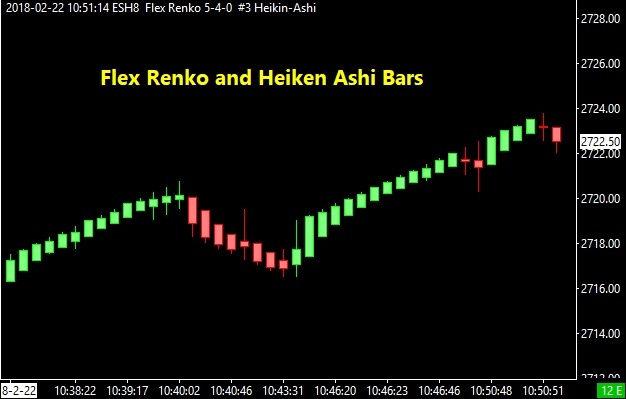
T3, or Trade The Trend, is a trend following system, which has as its goal to identify and ride long trends for high returns. The Flex Renko bars, combined with the Heiken Ashi study, transform ordinary candles into trending candles and indecision candles. A trending candle appears to be a solid body with only one wick.
1 Minute Candles show you time based price actionFlex Renko Bars are Range based, the bar closes when price has moved a certain number of ticks. In this case, 15.The combination of Flex Renko bars and the Heiken Ashi study smoothes out price action so trend is easily identified.
Heiken Ashi bars indicate indecision when there are two wicks. They indicate trend when there is one wick pointing in the direction of the trend.
This auto trade chartbook will allow the user to decide to auto trade when market conditions appear favorable. It is not intended to be a “set it and forget it” tool. It will win some and lose some trades. Discretion is recommended, when deciding to enable or disable auto trading at any point in time. The main benefit of auto trading is getting you into a trade so you can manage it.
Flexible rules for implementing the study on any symbol.
The min and max tick movements required to be a valid entry are adjustable by the user.
Attached orders are supported. Set targets and stops as you like.
Adjustable order quantities, default is 1. (Even if you change the attached order. See “Changing the Order Quantity” in Setup.
User selectable daily maximum profit and loss limits. Auto trade will stop for the day if either of these are hit.
Defaults:
Daily Max Profit: $100
Daily Max Loss: ($100)
Optional rule to not enter below (long)/above (short) VWAP.
Option to disable the Moving Average Exit cross rule for backwards compatibility with S3 v 1.0.
Any type of candle can be used: Volume Bars are the default. A Volume Bar consists of x (e.g. 3000) contracts before closing and creating a new bar. The number x is set in the chart settings.
The last bar’s volume countdown to zero is displayed on the chart.
Volume Bar and Flex Renko Heiken Ashi bar charts in the same chartbook, allowing the selective trading of two strategies based on market conditions.
S3 M8 charts have 8 symbols in one chartbook. These are set to monitor trades from other charts, but they can also be enabled to auto-trade as a live dashboard. In support of Live Trading Challenges, the total number of open positions across the 8 symbols is displayed in the upper left window. This is a read only display and is not configured to prevent trading beyond any maximum limit.
When the 8 EMA crosses above the T3-8 MA, we are looking for long entries.
When the 8 EMA crosses below the T3-8 MA, we are looking for short entries.
T3 Rule:
Setup Long when a candle closes above the T3-8 MA
Setup Short when a candle closes below the T3-8 MA
Signal Rule:
Long: On the next candle following a candle that meets the T3 Rule Setup, a Cyan color bar is one that closes a minimum number (e.g. 5) of ticks, and no more than a maximum number of ticks (e.g. 24) above the previous Setup Candle. A Dark Cyan candle is one that exceeds the maximum number of ticks, but otherwise meets the basic rules.
Short: On the next candle following a candle that meets the T3 Rule Setup, a Magenta color bar is one that closes a minimum number (e.g. 5) of ticks, and no more than a maximum number of ticks (e.g. 24) above the previous Setup Candle. A Dark Magenta candle is one that exceeds the maximum number of ticks, but otherwise meets the basic rules.
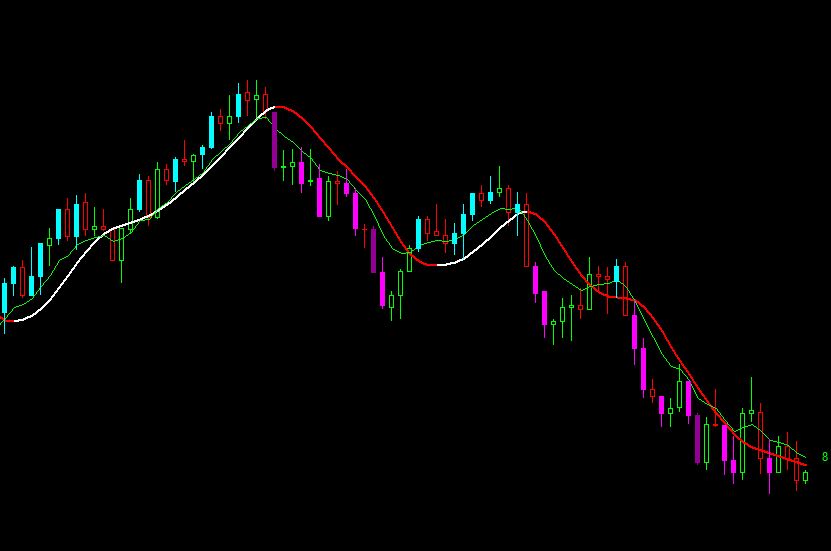
Figure 1. An example of the Basic Strategy.
Looking at the chart in Figure 1, one could take an entry after the close of any of the colored bars, and many would work out OK. However, to improve the probability of a profitable trade, two new rules were added. These Enhanced Rules require that the T3-8 slope be in sync with the direction of the trade, and limits the number of entries to 1 per crossover, to help avoid losing trades at the end of a trend.
The S3 Enhanced System Strategy (starting with Cyan and Magenta bars from the Basic Strategy) adds additional rules to filter out some trades:
T3-8 Slope Rule:
Long: Cyan Bar must appear with a positive (White) sloping T3-8 Moving Average.
Short: Magenta Bar must appear with a negative (Red) sloping T3-8 Moving Average.
First Candle Rule:
Long: Enter a Buy Market Order after the close of the first Cyan Candle after the 8 EMA cross over from below the T3-8 MA that meets the T3-8 slope rule.
Short: Enter a Sell Market Order after the first Magenta Candle after the 8 EMA cross over from above the T3-8 MA that meets the T3-8 slope rule.
Optional VWAP Rule:
Long: Only if above the Daily VWAP.
Short: Only if below the Daily VWAP.
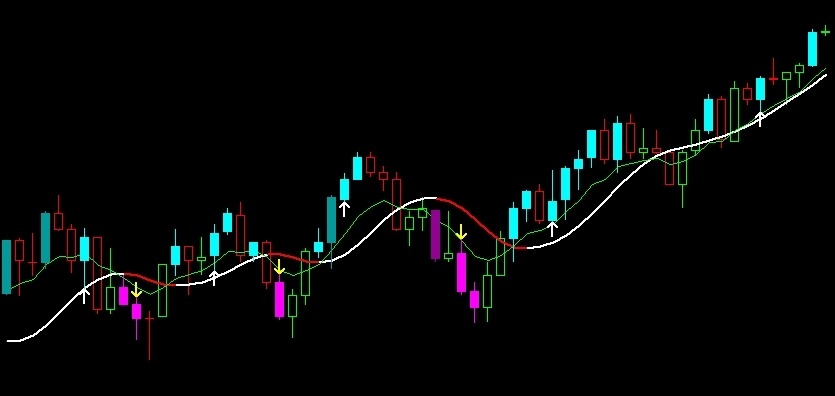
Figure 2. The Basic and Enhanced Rules together
In Figure 2, we see white and yellow arrows. These indicate where the Auto Trade study, following the additional Enhanced rules, would make trade entries. The Long entries are White Up Arrows and the Short Entries are Yellow Down Arrows. In this example, the enhanced rules reduce the number of possible trades in the Basic Strategy from 27 (the number of cyan and magenta bars) to 8. While this is a fairly choppy time period, most of these trades would have worked out OK, providing the target is not too far from the entry. You can see there are bars that would have been OK, but they don’t meet the T3 slope rule.
Exit Rules
T3 Cross:
Long: Exit when price action closes below the T3 MA or when 8 EMA Crosses T3-8 MA from above.
Short: Exit when price action closes above the T3 MA or when 8 EMA Crosses T3-8 MA from below.
Target Hit
Stop Hit
Manually Flatten
Why two strategies?
The Basic strategy is easily implemented in Sierra Chart using the Color Bar Based on Alert study. For every bar it looks at the previous bar to see if it closed above the T3 study. It also looks at the current bar, to see if it closed far enough away from the previous close. Users who purchased the Manual Chartbooks will only see these bars and will need to follow the Enhanced rules in their head, deciding visually if a bar is the first bar to close after the crossover that is also in sync with the slope of the T3.
The Enhanced rules require more complex formulas to count bars and compare them to moving average crossovers and the slope of the T3 MA. The Spreadsheet Study for Trading enables these rules, as well as managing the trade entries and exits.
Manage Consent
To provide the best experiences, we use technologies like cookies to store and/or access device information. Consenting to these technologies will allow us to process data such as browsing behavior or unique IDs on this site. Not consenting or withdrawing consent, may adversely affect certain features and functions.
Functional
Always active
The technical storage or access is strictly necessary for the legitimate purpose of enabling the use of a specific service explicitly requested by the subscriber or user, or for the sole purpose of carrying out the transmission of a communication over an electronic communications network.
Preferences
The technical storage or access is necessary for the legitimate purpose of storing preferences that are not requested by the subscriber or user.
Statistics
The technical storage or access that is used exclusively for statistical purposes.The technical storage or access that is used exclusively for anonymous statistical purposes. Without a subpoena, voluntary compliance on the part of your Internet Service Provider, or additional records from a third party, information stored or retrieved for this purpose alone cannot usually be used to identify you.
Marketing
The technical storage or access is required to create user profiles to send advertising, or to track the user on a website or across several websites for similar marketing purposes.